Webinar: How AI Agents Are Transforming Sales Compensation Management | Wednesday, July 22
Register
- A sales report should do more than summarize numbers — it should help revenue teams make faster and better decisions.
- According to Aberdeen Group, B2B companies that track at least 5 distinct sales report types outperform others by 12% in year-over-year revenue growth.
- The most effective sales reports focus on a limited set of actionable sales metrics tied to pipeline health, forecasting, and team performance.
- Maintaining strong CRM hygiene is essential to avoid inaccurate reporting and improve visibility across the entire sales funnel.
- Automated dashboards and real-time reporting tools help sales operations teams reduce manual work, improve forecasting accuracy, and better forecast future revenue.
Are you struggling to translate complex sales data into a story that executives can actually grasp? Do you find yourself buried in spreadsheets, spending more time compiling numbers than analyzing them to drive growth?
For many sales managers, creating reports is an overwhelming task that distracts from core responsibilities like coaching teams and closing deals. The good news is that it doesn't have to be this stressful.
With the right approach, a clear understanding of your goals, and powerful tools, you can transform your reporting process. Instead of delivering dry, number-heavy documents, you can create dynamic, insightful reports that highlight key trends, uncover opportunities, and empower your entire organization to make smarter, data-driven decisions. This guide will walk you through everything you need to know to master the art of the sales report.
What is a sales report?
A sales report, at its core, is a document that summarizes a company's sales activities and performance over a specific period. Think of it as a comprehensive snapshot of your sales engine, detailing everything from leads generated and new accounts won to revenue generated and individual and team performance.
However, its purpose goes far beyond simple record-keeping. An effective sales report is a strategic tool used by managers, directors, and executives to understand performance, identify bottlenecks in the sales process, and make informed business decisions that fuel growth.
These reports are not just about looking backward, they are about paving the way forward. By analyzing the data, you can measure your team against targets, spot emerging trends, and refine your sales strategy for optimal results. For example, if a report reveals a dip in sales in a particular region, you can investigate the cause and take corrective action, whether it's providing more training to local reps or adjusting your marketing efforts.
Ultimately, a well-crafted sales analysis provides actionable intelligence. It helps you understand customer behavior, identify your most valuable prospects, and pinpoint what sets your top performers apart. It's the compass that guides your sales strategy, ensuring your efforts are always aligned with your most important business goals.
The essential steps for building a sales report
Anyone can dump numbers into a spreadsheet, but creating a report that captures attention, tells a compelling story, and drives action requires a more thoughtful process. The real challenge is communicating the right data in a way that doesn't put your audience to sleep.
Step 1: Define the purpose and audience
📊 Figures to remember
According to Forrester Research, 70% of B2B execs say they receive reports that don’t match their strategic needs.
Before you collect the data, you must be crystal clear on why you're creating the report and who it's for. You can't include every metric, so focus on the data that supports specific goals. Are you trying to measure the effectiveness of a new promotional campaign? Do you need to build an accurate sales forecast for the next quarter? Or is the report intended to motivate your team by highlighting their progress toward key performance indicators (KPIs)? Your objective will determine the scope of the report and the metrics you need to track.
Once the purpose is clear, define your audience. You wouldn't send the same email to a CEO and a marketing director, and you shouldn't send them the same sales report. Each stakeholder cares about different information.
- CEO & C-Suite: They are interested in the "big picture", overall revenue growth, market share, and profitability. They need a high-level summary that connects sales performance to the company's bottom line.
- Sales Director/VP of Sales: This person is focused on team performance, quota attainment, and the health of the sales pipeline. They need detailed data on win rates, average deal size, and sales cycle length.
- Sales Managers: They require granular data on their individual reps' activities, such as calls made, meetings scheduled, and conversion rates at each stage of the funnel.
- Marketing Team: They want to see which campaigns are generating the most valuable leads and driving the most profitable sales, helping them calculate marketing ROI.
Step 2: Gather and verify your sales data
With a clear purpose and audience in mind, it's time to collect your data. To ensure this process is efficient and hassle-free, you should rely on a central source of truth, typically a Customer Relationship Management (CRM) system. A CRM consolidates all your sales information, allowing you to easily track customer interactions, manage leads, and monitor sales activities in one place. Pull data from your CRM, financial systems, and any other relevant platforms.
However, raw data is often messy. You must take the time to clean and verify it to ensure accuracy. This involves removing duplicate records, correcting inconsistencies, and filtering the information to focus on the relevant date. For instance, if you're creating a report on enterprise sales, you'd exclude data from your SMB segment.
Consistency is also key, so establish a regular schedule for data collection, whether it's daily, weekly, or monthly, to ensure your insights are always based on up-to-date information. Finally, define the period your report will cover and, for context, compare it to a previous period (e.g., this quarter vs. last quarter or year-over-year).
Step 3: Visualize and tell a story
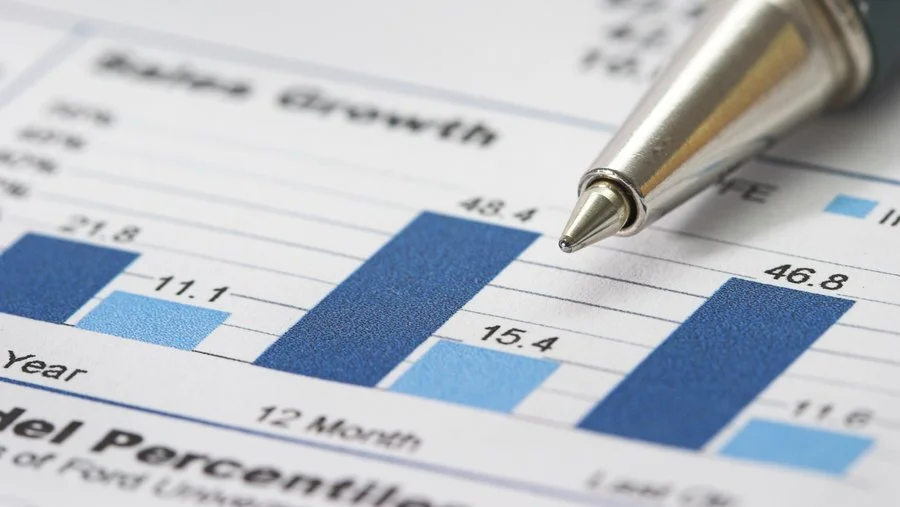
The way you present data is just as important as the data itself. A slide full of text or a dense spreadsheet is the fastest way to lose your audience's attention. This is where data visualization becomes your greatest asset. Charts and graphs transform complex numbers into clear, digestible insights that highlight important trends and challenges at a glance.
- Line Graphs are perfect for showing trends over time, such as revenue growth or the number of new leads per month.
- Bar Graphs excel at comparing different categories, like the performance of individual sales reps or the sales volume across different regions.
- Pie Charts effectively illustrate proportions, such as how much each product contributes to total revenue.
- Funnel Charts are ideal for visualizing the conversion rate at each stage of your sales pipeline, immediately showing where leads are dropping off.
An effective report doesn't just present data—it tells a story. Use your visuals to guide your audience through the information. Explain the context behind the numbers. Why did sales spike in March? What caused the dip in win rate last quarter? Your analysis and explanations are what turn raw data into actionable intelligence.
Step 4: Contextualize the figures to make them usable
The best sales reports don't just inform—they inspire action. For every key finding, you should include a specific, actionable recommendation. Numbers on their own can be misleading without context. Simply stating that the team's win rate dropped by 5% isn't enough. You need to explain why it happened and what you plan to do about it.
For example, if your report identifies a drop in win rate, your actionable recommendation might be to implement a new sales training module focused on objection handling or to review your lead qualification process to ensure reps are spending time on the right prospects. If you discover that deals are stalling at the proposal stage, you might recommend creating new proposal templates or providing reps with better competitive intelligence. By connecting every insight to a concrete next step, you transform your report from a passive document into an active tool for driving improvement.

Why sales reporting matters for revenue teams
Sales reporting is no longer just a management exercise.
For modern revenue organizations, it has become a critical tool for improving visibility, aligning teams, and making faster decisions. Without accurate sales reporting , sales leaders often struggle to understand what is actually driving performance, where deals are slowing down, or how forecasts are evolving.
As sales organizations scale, reporting also becomes essential for creating alignment between Sales, Finance, and RevOps teams.
Improve visibility across the sales pipeline
One of the main objectives of sales reporting is to improve pipeline visibility.
A well-structured sales report helps teams understand:
- how opportunities progress through the sales funnel,
- where deals are getting stuck,
- and which stages generate the highest conversion rates.
Without this visibility, pipeline management quickly becomes reactive instead of proactive.
Sales leaders need access to real-time information to identify risks early, prioritize the right opportunities, and maintain healthy pipeline coverage throughout the quarter.
This becomes even more important in fast-growing organizations where multiple teams contribute to the sales process.
Support better forecasting and decision-making
Reliable sales reporting plays a central role in forecasting accuracy, allowing leaders to effectively forecast future revenue.
Revenue leaders rely on reporting evaluating:
- expected revenue,
- quota attainment,
- sales velocity,
- and overall business performance.
When reporting is delayed or based on unreliable spreadsheet updates, forecasting becomes significantly more difficult.
On the other hand, centralized and automated reporting allows teams to adjust forecasts continuously and make faster decisions based on up-to-date data.
This helps organizations anticipate revenue gaps earlier and react before targets are impacted.
Align sales, finance, and RevOps teams
Sales reporting is not only useful for sales managers.
Finance teams use reporting to monitor revenue performance and commission impact, while RevOps and sales operations teams rely on it to improve operational efficiency and process consistency.
When different departments work from disconnected spreadsheets or inconsistent data sources, alignment quickly becomes a challenge.
Shared reporting systems help create:
- more transparency,
- better collaboration,
- and faster decision-making across revenue teams.
This is one of the main reasons many companies move toward automated reporting platforms connected directly to CRM and compensation systems.
Identify performance trends faster
Sales reporting also helps organizations identify trends before they become larger performance issues.
For example, reports can quickly reveal:
- declining conversion rates,
- slowing sales cycles,
- lower rep activity,
- or increasing churn risk.
Having access to these insights early allows sales leaders to react faster and implement corrective actions before revenue performance is affected.
Over time, consistent reporting also helps organizations better understand:
- what drives top performance,
- which sales motions are most effective,
- and where operational improvements can have the biggest impact.
Main types of sales reports to use
There is no one-size-fits-all sales report. Different reports serve different purposes, highlighting specific aspects of your sales process. A robust reporting strategy incorporates several types of reports to provide a holistic view of performance. Here are some of the most essential ones:
Sales Pipeline Report
- Purpose & Key Metrics: Provides a forecast of future revenue by showing the number and value of deals at each stage of the sales funnel. Tracks pipeline value, number of deals, and stage conversion rates.
Conversion (Win/Loss) Report
- Purpose & Key Metrics: Shows how effectively your team converts leads into customers. It highlights the strengths and weaknesses of your sales strategy and individual reps. Tracks win rate, loss rate, and reasons for lost deals.
Sales Forecast Report
- Purpose & Key Metrics: Estimates how much a company, team, or individual rep will sell over a specific period (week, month, quarter). Helps in spotting potential issues early. Tracks projected revenue vs. quota.
Sales Activity Report
- Purpose & Key Metrics: Measures the sales efforts and hustle of your sales team by tracking key activities. Ensures reps are putting in the work where it matters most. Tracks calls made, emails sent, meetings scheduled, and demos given.
Customer Churn Report
- Purpose & Key Metrics: Tracks the rate at which customers stop doing business with you. A high churn rate can indicate issues with product-market fit or that you're targeting the wrong prospects. Tracks churn rate and common traits of churned customers.
Average Deal Size Report
- Purpose & Key Metrics: Helps determine the number of sales needed to hit a revenue target and assists in capacity planning. Tracks the impact of discounts and rep performance. Tracks average revenue per deal.
Sales Cycle Length Report
- Purpose & Key Metrics: Measures the average time it takes to close a deal, from initial contact to final signature. A shortening sales cycle can indicate increased efficiency. Tracks average days to close.
📊 Figures to remember
B2B companies that track at least 5 distinct sales report types outperform those that don’t by 12% in YoY revenue growth (Aberdeen Group).
How often should you create sales reports?
The frequency of your sales reporting should reflect the pace of your sales cycle and the decisions your teams need to make.
Some metrics require daily monitoring, while others are more relevant on a monthly or quarterly basis. The key is finding the right reporting cadence without overwhelming teams with unnecessary updates.
Well-structured reporting routines help revenue teams stay proactive, improve forecasting accuracy, and identify performance issues before they impact results.
Daily sales reports
Daily sales reports are mainly used for operational visibility.
They help sales managers and team leads monitor short-term activity and react quickly when pipeline generation or deal progression slows down.
Daily reports often include:
- new opportunities created,
- meetings booked,
- calls completed,
- deals moved through the pipeline,
- and revenue generated during the day.
This type of reporting is particularly useful for high-volume sales teams or organizations with short sales cycles.
However, daily reporting should remain concise. The goal is not to overload teams with data, but to provide quick visibility on operational performance.
Weekly sales reports
Weekly sales reporting is often the most effective cadence for sales management.
It provides enough data to identify trends while still allowing teams to react quickly and adjust priorities throughout the quarter.
Weekly reports are commonly used to:
- review pipeline health,
- analyze conversion rates,
- monitor rep performance,
- track quota progression,
- and identify blocked opportunities.
This reporting rhythm also supports better coaching conversations between managers and sales reps.
Instead of focusing only on end-of-quarter results, weekly reporting helps teams improve execution continuously.
Monthly sales report
Monthly reports focus more on strategic analysis and business performance.
These reports are generally shared with:
- sales leadership,
- finance teams,
- RevOps,
- and executive stakeholders.
They provide a broader view of:
- revenue growth,
- forecast accuracy,
- sales productivity,
- compensation impact,
- customer retention,
- and long-term trends.
Quarterly reporting is also essential for evaluating whether sales strategies, territories, or compensation plans need to be adjusted.
As organizations scale, these reporting processes become difficult to maintain manually. This is why many companies move toward automated dashboards connected directly to CRM and commission systems to centralize reporting in real time.
Advanced reporting techniques for sales leaders
Now that you've mastered the basics, you can enhance your reporting with advanced techniques that provide more in-depth, predictive information. These methods transform reporting from a descriptive exercise into a prescriptive one, telling you not only what has happened, but what is likely to happen next.
1. Cohort Analysis: This technique involves grouping customers based on a shared characteristic and tracking their behavior over time. It can reveal invaluable insights into customer lifetime value (CLV), churn rates, and the long-term impact of your sales strategies.
For example, a cohort analysis might reveal that customers acquired during a specific promotional period have a 30% higher retention rate after one year, informing your future marketing efforts.
2. Funnel Velocity: Most managers track conversion rates, but few monitor the speed of the funnel, i.e. the speed at which customers progress through the sales process. By measuring the time spent at each stage, you can identify bottlenecks. If you find that business consistently stalls at the proposal stage, you can investigate the cause and take action, whether it's simplifying your proposals or providing more negotiation training.
📊 Figures to remember
The average B2B SaaS sales cycle is 84 days (SaaStr). If your cycle is longer, look into stage-specific delays.
3. Win/Loss Analysis: Every deal, win or lose, is a learning opportunity. Don't just track results, implement a systematic win/loss analysis process. This means investigating or interviewing prospects and understanding the specific factors that influenced their decision.
Further analysis might reveal that contracts for which you provided a product demonstration within the first two weeks have a higher success rate, prompting you to make early demonstrations a standard part of your sales process.
4. Predictive Analytics & AI: The future of sales reporting lies in artificial intelligence (AI) and machine learning (ML). These technologies can analyze historical data, your current pipeline or external market factors to generate accurate sales forecasts.
AI-powered predictive lead scoring models can identify the prospects most likely to convert, enabling your team to prioritize their efforts on high-value opportunities.
Common sales reporting mistakes to avoid
Even with the right tools, many sales reports fail to deliver actionable insights.
In most cases, the issue is not the lack of data. It is the way the reporting process is structured.
Tracking too many KPIs
One of the most common mistakes is trying to monitor everything at once.
When reports contain too many sales metrics, teams often lose visibility on what truly matters. A good sales report should prioritize clarity over volume.
The most effective reports usually focus on a few KPIs directly linked to revenue outcomes.
Using outdated or unreliable data
Sales reports are only as reliable as the data behind them.
When teams rely on manual exports, disconnected spreadsheets, or inconsistent CRM updates, reporting accuracy quickly becomes an issue. This often leads to:
- commission disputes,
- forecasting errors,
- and slower decision-making.
Automated reporting workflows significantly reduce these risks by synchronizing data in real time.
Building reports without a clear objective
A report should always answer a specific business question.
For example:
- Why is pipeline conversion slowing down?
- Which reps are below target?
- Are forecasts still realistic?
- Which territories are underperforming?
Without a clear objective, reporting quickly becomes a repetitive administrative task instead of a decision-making tool.
Failing to turn insights into actions
Sales reporting should support action, not just observation.
The best sales teams use reporting to:
- coach reps,
- improve conversion rates,
- adjust territories,
- optimize compensation plans,
- and improve forecasting accuracy.
A report that nobody acts on has very limited value.
Consider software sales report for a better performance
In today's fast-moving digital landscape, relying on manual spreadsheets for sales reporting is like trying to win a Formula 1 race on a bicycle. It's slow, prone to human error, and can't provide the real-time information needed to stay competitive. This is where dedicated sales reporting software becomes indispensable.
Go beyond spreadsheets
Traditional tools like Excel and Google Sheets require you to manually set up formulas, design visuals, and input data from scratch. This is an time sink that could be better spent on high-value activities. A sales reporting platform automates this entire process. Because it's already tracking and storing your sales data in real-time, it can generate customized, detailed reports almost instantly. You can easily view any timeframe, set custom date ranges, compare performance to previous periods, and analyze data without wrestling with complex formulas.
Platforms like Qobra also help revenue teams centralize sales performance data, automate reporting workflows, and give employees full visibility into their targets, commissions, and performance metrics in real time.
The rise of automated, real-time dashboards
The biggest advantage of a dedicated sales analytics tool is the shift from static, month-end reports to dynamic, live dashboards. It’s like a central hub where you can see live updates on your most critical KPIs—daily sales, pipeline value, team activity levels, and more. This allows you to spot trends and issues as they happen, not weeks later. If a live dashboard alerts you to a sudden drop in lead conversion, you can intervene immediately to diagnose and fix the problem, making a significant difference to your bottom line.
Furthermore, these platforms put your reporting on autopilot. You can visualize, analyze, and report on performance all in one place, with the ability to schedule report sends and reminders.

FAQ - Sales report
How can I improve my current sales reporting process?
To improve your sales reporting, start by moving away from manual methods and embracing technology. The single most impactful step is to adopt a modern CRM or a dedicated software sales report tool. This will automate data collection, ensure accuracy, and provide access to live dashboards for real-time insights. From there, focus on the fundamentals: clearly define the goal and target audience for each report, use strong data visualizations to tell a story, and always include actionable recommendations. Finally, elevate your strategy by incorporating advanced techniques like funnel velocity analysis and systematic win/loss reviews to uncover deeper insights that drive performance.
What about free templates for sales report?
If you're not quite ready for a dedicated software solution or want to organize your thoughts before building a dashboard, templates are a good starting point.
- CRM Providers: HubSpot, Zoho, and many others offer free sales report templates for Google Sheets and Excel. These are professionally designed and contain all the key formulas you need.
- Spreadsheet Software: Both Google Sheets and Microsoft Excel have their own galleries of free, built-in templates. Search for ""sales report"" or ""sales dashboard"" to find a solid starting point.
What makes an effective sales reporting software?
An effective software sales report combines accurate, up-to-date data with clear visualizations and actionable insights. It should include key performance indicators such as revenue trends, conversion rates, pipeline metrics, and customer acquisition costs, while also offering specific recommendations to address any shortcomings. The best reports streamline the data collection process by integrating with your CRM and other tools, offering real-time updates and customizable templates that meet the needs of both detailed operational teams and high-level executives.
How do you automate sales reporting?
Sales reporting can be automated by connecting CRM platforms, business intelligence tools, and commission software into a centralized reporting workflow.
- Automation allows companies to:
- update dashboards in real time,
- reduce spreadsheet errors,
- improve forecast accuracy,
- and simplify sales operations.
Automated reporting also improves visibility across teams by ensuring everyone works from the same data source.
As organizations scale, automation becomes essential for maintaining accurate and actionable reporting without increasing administrative workload.