This sales quota calculator does two jobs in one place: it tracks quota attainment during a period, and it sets next year's quota with three independent methods. Keep the example values or type your own; results update as you go and nothing leaves your browser.
01
Track attainment and pace
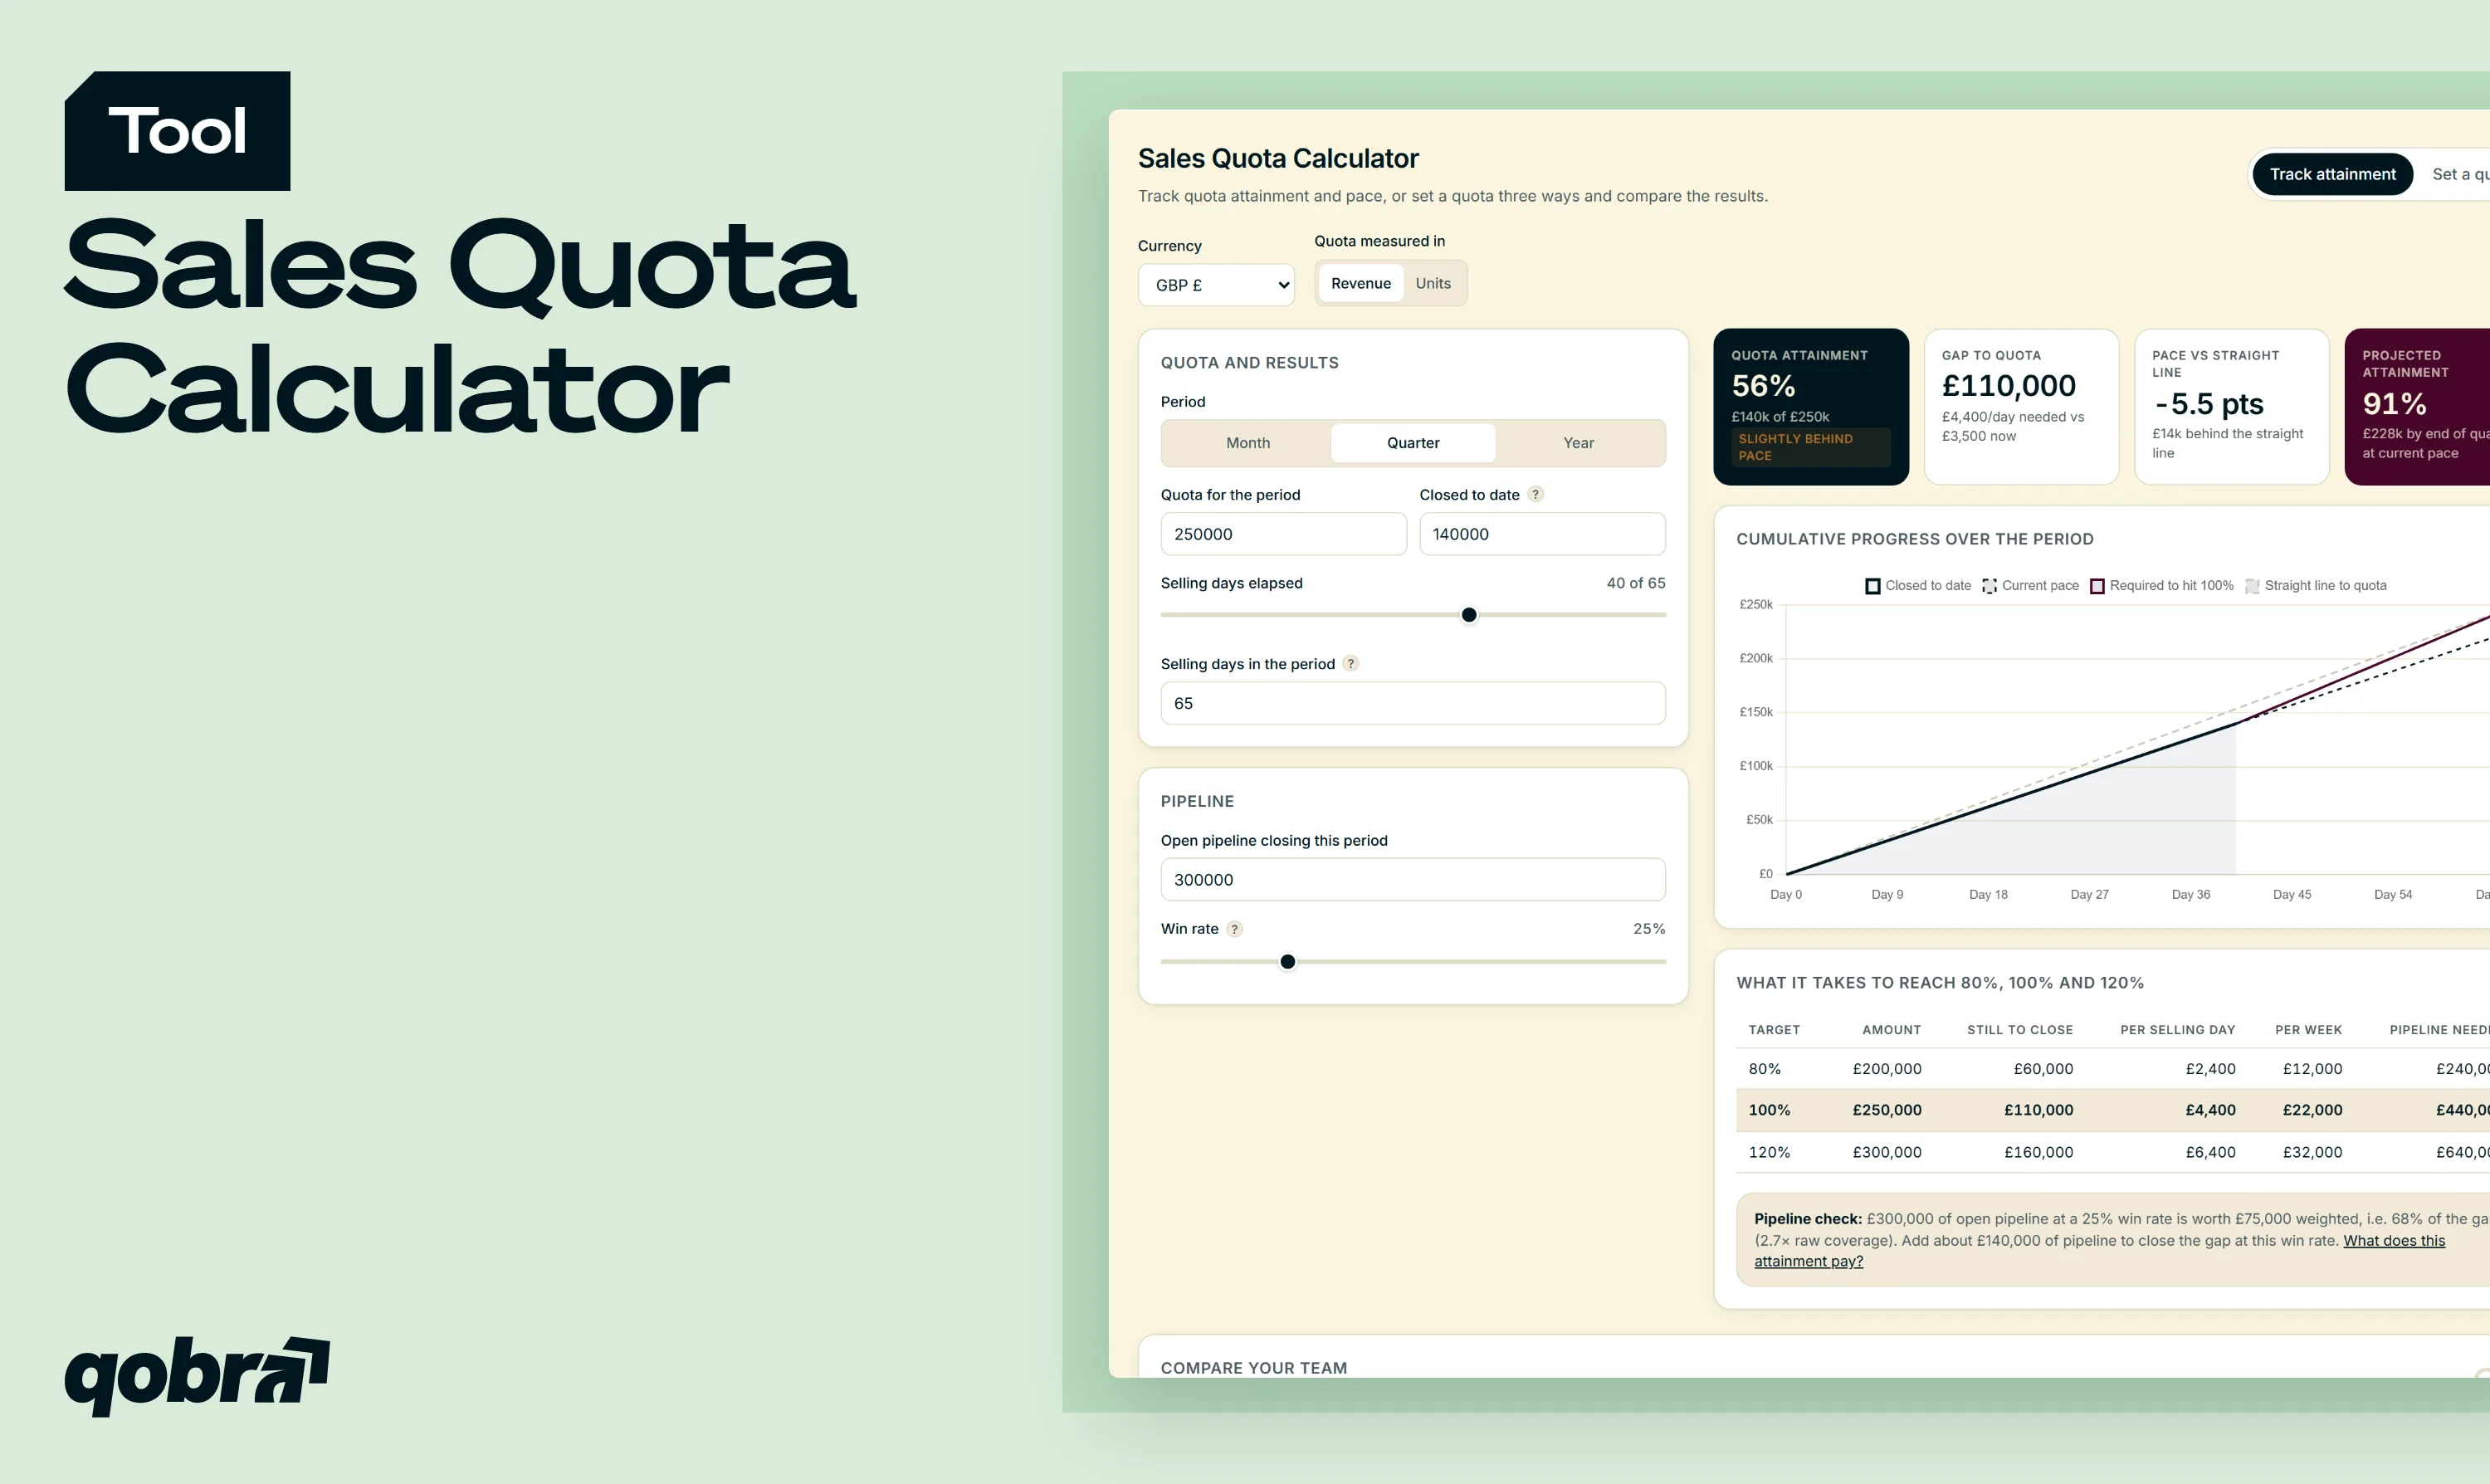
Enter the quota, what is already closed, the selling days elapsed and your open pipeline. You get attainment, the gap to quota, pace, an end-of-period projection and the run rate needed per selling day.
02
Set a quota three ways
The second tab computes an annual quota from OTE, from a team target and from rep capacity, side by side, with the share capacity funds and a first-year figure prorated for ramp.
03
Compare your team
Turn on the team view to compare, for up to 10 reps, average attainment with the share of reps who actually reached 100% of quota.
What you can model
Every lever of quota tracking and quota setting, from pace to ramp, in one calculator.
01
Attainment and pace
Read attainment, the gap to quota and pace against a straight line, then an end-of-period projection at your current run rate.
02
Paths to 80%, 100% and 120%
See the amount left to reach each milestone, the run rate it needs per selling day and per week, and the pipeline it requires.
03
Weighted pipeline coverage
Apply a win rate to open pipeline to see how much of the remaining gap it covers, and how much pipeline to add.
04
Quota set three ways
Compare OTE × ratio, top-down and capacity quotas side by side, with the share capacity funds and a first-year figure prorated for ramp.
05
Team attainment
Enter up to 10 reps to compare average attainment with the share of reps who actually reached quota.
Sales Quota Calculator
Track quota attainment and pace, or set a quota three ways and compare the results.
Quota measured in
Quota and results
Period
Pipeline
Quota attainment
—
—
Gap to quota
—
—
Pace vs straight line
—
—
Projected attainment
—
—
Cumulative progress over the period
What it takes to reach 80%, 100% and 120%
Target
Amount
Still to close
Per selling day
Per week
Pipeline needed
Compare your team
Average attainment vs share of reps at quota.
Rep
Quota
Closed
Att.
1 · From OTE
2 · Top-down
3 · Bottom-up capacity
Ramp and proration
Quota to retain
Annual quota
—
—
Funded by capacity
—
—
Quota : OTE
—
—
Year-1 prorated quota
—
—
Three methods side by side
Method comparison
Method
Annual
Quarterly
Monthly
Quota : OTE
vs capacity
The default tab works as a quota attainment calculator. Month, Quarter and Year presets load 22, 65 and 260 selling days, and a units mode covers quotas counted in deals.
Sales quota formulas
Every result comes from a few formulas. Here they are with the tool's default example: a £250,000 quarterly quota, £140,000 closed after 40 of 65 selling days, £300,000 of open pipeline and a 25% win rate.
Quota attainment (percent to quota)
Quota attainment = closed revenue ÷ quota × 100. It is also called percent to goal or sales quota percentage. In the example, £140,000 ÷ £250,000 = 56%, and the gap to quota is £110,000.
Pace-adjusted attainment
Pace = attainment − share of the period elapsed. After 40 of 65 selling days, 61.5% of the quarter is gone, so the rep is 5.5 points behind a straight line, or £13,846 short of an even pace.
At £3,500 per selling day, the quarter ends at £227,500, or 91% of quota. Closing the gap takes £4,400 per day, or £22,000 per week, over the 25 days left. If your quarters are usually back-loaded, read the pace with that pattern in mind.
Pipeline needed to hit quota
Pipeline needed = remaining gap ÷ win rate. The £110,000 gap at a 25% win rate needs £440,000 of pipeline that can close this period. The £300,000 already open is worth £75,000 weighted, or 68% of the gap, so about £140,000 more is required.
To project the whole quarter from weighted pipeline and run rate together, use the sales forecast calculator.
How to set a sales quota
A sales quota is the result a rep is expected to deliver in a period. Set it by checking one method against another. The default Mid-Market AE example:
OTE × ratio: a £180,000 OTE at 4.5× gives an £810,000 annual quota, with an 11.1% commission rate on £90,000 of variable pay.
Top-down: an £8,000,000 team target, 10% over-assignment and 10 ramped reps give £880,000 per rep.
Bottom-up capacity: £40,000 deals × 22% win rate × 9 qualified opportunities a month × 12 months give £950,400.
Start from capacity, not last year + X%
Adding a flat percentage to last year's number ignores what a rep can produce. Capacity is the reality check: here it funds 117% of the £810,000 quota, so the target is reachable with the current deal flow. If capacity falls short, work on opportunities, win rate or the quota itself.
To see which lever moves revenue fastest, run the same inputs through the sales velocity calculator.
Prorate for ramping and mid-year hires
New hires need time before they carry a full number: Bridge Group puts AE ramp time at 6.2 months in the US market. In the calculator, the first half of the ramp counts at 50% of quota, the second half at 75%, then 100%. A rep who starts in April with a six-month ramp carries 56.25% of the annual figure in year one: £455,625 instead of £810,000.
What is a good quota-to-OTE ratio?
The quota-to-OTE ratio divides the annual quota by on-target earnings. It shows how much revenue each pound of pay is expected to bring in.
According to Bridge Group's 2026 AE report, the median US account executive carries a $960K quota for a $200K OTE, a ratio of 4.6×, up from 4.2× in 2024. The same report shows quotas growing about 2.4% a year while OTE grew about 4.9%.
Treat the median as a reference, not a rule: deal size, sales cycle and win rate decide what a rep can carry. To size the pay side of the ratio, use the ote calculator.
What is a good quota attainment rate?
For an individual rep, 100% is the line that matters. For a team, the better question is how many reps get there: Bridge Group reports that 48% of US reps reached their annual quota in 2026, down from 51% in 2024.
Reps are cautious about their own odds too. In Salesforce's State of Sales report, 18% of reps expected to reach exactly 100% of quota this year and 17% expected to go beyond it. For attainment benchmarks and ways to improve them, read our guide to sales quota attainment.
Why team average hides misses
An average mixes top performers with reps far below target. In the calculator's team example, six reps average 101% attainment, yet only three reached quota: two results at 150% and 121% pull the average up. Track the share of reps at quota next to the average before changing quotas for everyone.
From calculator to automation
From calculator to live quota attainment
A calculator gives you a snapshot. In a live plan, attainment moves every time a deal closes, a split applies or a territory changes, and it must follow the same crediting rules as commission.
Qobra connects to your CRM and calculates quota attainment and commissions from the same rules, in real time. Reps see their attainment, their pace and what the next deal pays, accelerators included. RevOps and Finance stop rebuilding attainment reports in spreadsheets.
Attainment live, deal by dealQuota attainment updates in real time from the CRM, calculated with the same rules as commission.
Pace and payout in viewReps see their attainment, their pace and what the next deal pays, accelerators included.
No more attainment spreadsheetsRevOps and Finance stop rebuilding attainment reports by hand and work from one set of rules.
FAQ — sales quota calculator
How do you calculate a sales quota?
Use more than one method and compare. OTE × target quota-to-OTE ratio gives a pay-based quota. Team target × (1 + over-assignment) ÷ ramped reps gives a top-down quota. Deal size × win rate × qualified opportunities per month × 12 gives rep capacity. When capacity funds less than the quota, revisit the inputs, then prorate for reps who join or ramp during the year.
How do you calculate quota attainment?
Divide closed revenue by the quota and multiply by 100. A rep with £140,000 closed against a £250,000 quota is at 56% attainment. Use the revenue credited under your plan's rules, splits included, and the quota for the same period. Then compare it with the share of selling days elapsed to see whether the rep is on pace.
Is a 120% sales quota attainment good?
Yes. 120% means the rep closed a fifth more than the quota, a strong result when 48% of US reps reached their annual quota in 2026, according to Bridge Group. Check whether the quota was realistic and whether the plan pays accelerators above 100%. See what that attainment pays with our commission calculator.
What is a good quota-to-OTE ratio?
For account executives, the median is 4.6× according to Bridge Group's 2026 US data, up from 4.2× in 2024: about a $960K quota for a $200K OTE. Your own ratio should follow what reps can produce, so check the OTE method against the capacity method before you commit.
What is a typical sales quota?
There is no universal figure: it depends on role, segment and deal size. For US account executives, Bridge Group reports a median annual quota of $960K in 2026, growing about 2.4% a year. Other roles carry very different numbers, which is why the calculator builds a quota from your own deal size, win rate and deal flow.
Can quota attainment exceed 100%?
Yes. Attainment above 100% means the rep closed more than the quota, for example 125% when £312,500 is closed against £250,000. Most plans reward it with accelerators, a higher commission rate on revenue above quota. The calculator shows what it takes to reach 120%, so reps see the next milestone.
Should quota attainment be measured monthly, quarterly, or annually?
Measure it on the same period as the quota, and track pace inside that period. Annual quotas are usually split into quarterly or monthly targets so managers can act before the year is lost. Short sales cycles suit monthly tracking, long cycles quarterly. The presets load 22, 65 or 260 selling days, adjustable for bank holidays.
How much pipeline do I need to hit my quota?
Divide what is left to close by your win rate. With £110,000 still to close and a 25% win rate, you need £440,000 of pipeline that can close in the period. Your own win rate gives a more reliable target than a fixed coverage multiple, and the calculator shows how much of the gap your weighted pipeline already covers.



.webp)


