How to use this sales velocity calculator
A sales velocity calculator tells you how much revenue your pipeline produces per day. Enter four numbers from your CRM, pick a period, and see projected revenue, velocity per rep, quota coverage and the lever that closes the gap.
01Enter four numbers from your CRM
Qualified opportunities, average deal size (first-year ACV), win rate and sales cycle length in days. The presets are illustrative scenarios, not benchmarks: replace them with your own data.
02Pick a period and add your team
Choose month, quarter or year, then enter the reps carrying quota and the quota per rep. The calculator turns velocity into projected revenue, velocity per rep and quota coverage.
03Find the lever that closes the gap
Move the scenario levers to compare opportunities, deal size, win rate and cycle, read the path-to-quota table, then copy a shareable link or export to CSV.
What you can model
Every input of the sales velocity equation, from pipeline to quota, in one calculator.
01Revenue per day
See sales velocity with the formula applied to your numbers, then projected revenue for a month, a quarter or a year.
02Quota coverage
Compare projected revenue with team quota and read velocity per rep and the gap left to close.
03Lever simulator
Test more opportunities, bigger deals, a higher win rate or a shorter cycle, alone or combined, and compare their effect.
04Path to quota
Get the change needed on each lever, taken one at a time, to reach team quota over the period.
05Commission projection
Switch on an average commission rate to see the variable pay each scenario would generate.
Sales velocity
—
revenue per day
Cumulative revenue vs team quota
Lever simulator
| Lever | Change | New value | Velocity | Uplift |
|---|
Path to quota: pull one lever
Qualified opportunities are open deals past your qualification stage. Average deal size is the first-year contract value (ACV) of recently won deals. Win rate follows the win rate formula: won deals ÷ (won + lost deals). Sales cycle length is the average number of days from opportunity creation to closed-won. The presets are illustrative scenarios, not benchmarks.
Sales velocity is revenue per day. Multiplied by the days in the period (30, 90 or 365), it gives projected revenue. Quota coverage compares that revenue with team quota. The chart and the two tables show when the team crosses quota and what would move that date.
The sales velocity formula behind the calculator
Every result comes from one sales velocity equation: sales velocity = (qualified opportunities × average deal size × win rate) ÷ sales cycle length in days.
For definitions, variations and how each factor behaves, read our guide to the sales velocity formula.
Worked example
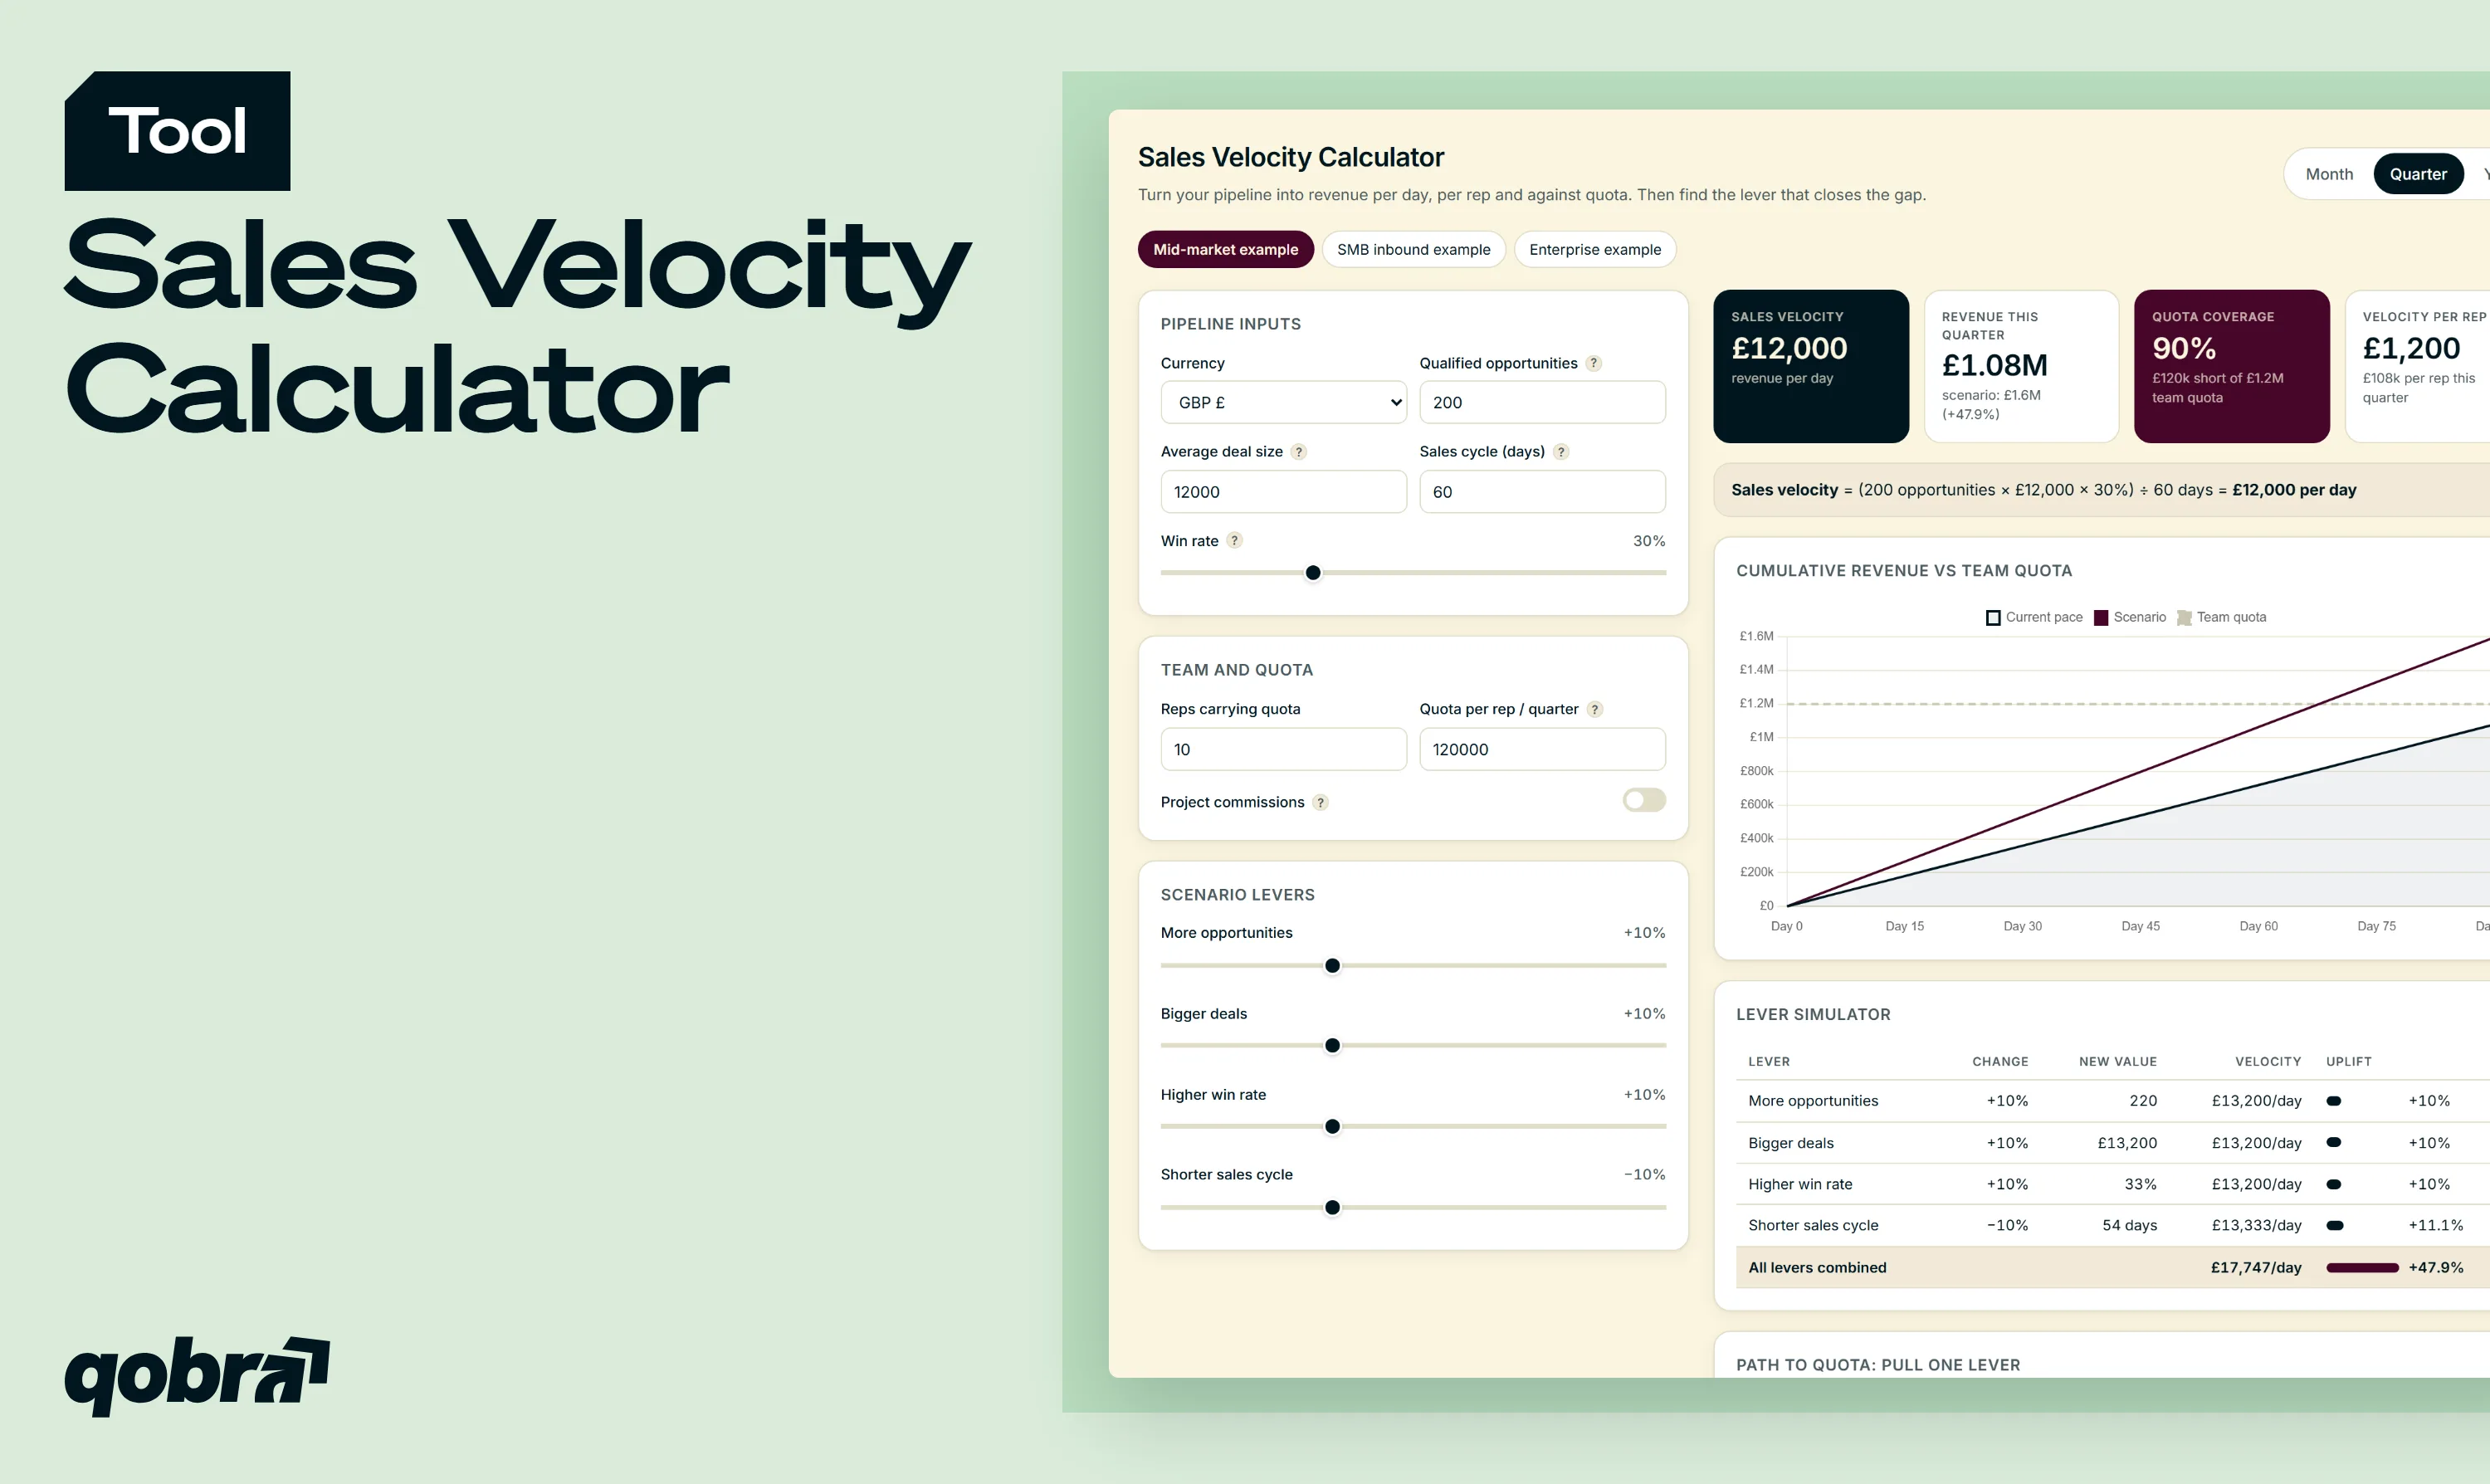
Take 200 qualified opportunities, a £12,000 average deal size, a 30% win rate and a 60-day cycle. The sales velocity calculation gives (200 × £12,000 × 0.30) ÷ 60 = £12,000 per day, or £1,080,000 over a 90-day quarter. With 10 reps carrying a £120,000 quarterly quota, team quota is £1,200,000: coverage is 90% and the gap is £120,000.
Sales velocity in Excel or Google Sheets
Put opportunities in B1, deal size in B2, win rate as a percentage in B3 and cycle days in B4, then enter =(B1*B2*B3)/B4. The calculator adds what a sheet makes tedious: scenarios, quota coverage and a reverse calculation.
What is a good sales velocity?
There is no universal good number: velocity scales with deal size and team size. A good sales velocity rises against your own baseline and covers your quota.
Compare this quarter with last year's, one segment with another (inbound vs outbound, SMB vs mid-market), and velocity per rep. Market data helps read the trend: the 2023 B2B Sales Benchmark Report, built on 3.2 million opportunities from 364 companies, found that from 2021 to 2022 average deal value fell 32%, win rates fell 15% and sales cycles grew 32%.
Which lever moves sales velocity the most?
Three inputs multiply and one divides. A 10% gain on opportunities, deal size or win rate lifts sales pipeline velocity by 10%. A 10% shorter cycle lifts it by 11.1%, because 1 ÷ 0.9 = 1.111. Improve all four by 10% and velocity rises 47.9%. The lever simulator in the sales velocity calculator shows this on your numbers.
More qualified opportunities
Extra pipeline only helps if qualification holds. A framework such as MEDDPICC keeps weak deals out.
Bigger deals
Multi-product packages, upsell at signature and a firm discount policy raise deal size. Deep discounts trade deal size for cycle time.
Higher win rate
Qualify earlier, disqualify faster and bring decision makers in sooner.
Shorter sales cycle
Mutual action plans, early legal review and a dated next step on every deal cut days from the cycle. The same report found that opportunities open for more than twice the average cycle had only a 3% chance to close.
From sales velocity to quota: set targets reps can hit
Velocity per rep multiplied by the days in a period gives capacity. In the example above, £1,200 per rep per day equals £108,000 per quarter, 11% short of a £120,000 quota.
The path-to-quota table turns that gap into one target per lever: 23 more opportunities, £1,333 more per deal, 3.3 more win-rate points or 6 fewer days of cycle. Pick the lever your team can really move, then check it against your sales quota attainment history.
The check matters: Ebsta reported that only 29% of reps hit quota in Q4 2022, and 67% of reps in the Salesforce State of Sales survey did not expect to hit quota that year. To set quotas from capacity and ramp, use our sales quota calculator.
How your commission plan shapes sales velocity
Reps move the levers the plan pays for. Design the plan with the four inputs in mind:
- Deal size: accelerators and an ACV-based rate reward bigger first-year contracts over long, discounted terms.
- Sales cycle: a short, time-bound SPIF on deals closed within the period pulls decisions forward.
- Win rate: reps who see what each deal pays focus on the deals they can win.
- Opportunities: paying SDRs on qualified meetings rather than raw leads protects volume and quality.
Faster velocity also raises variable pay. Turn on the commission projection to see the cost of each scenario, then model tiers and accelerators with the commission calculator.
Sales velocity vs pipeline velocity vs deal velocity
The terms overlap, so define them once for the whole team.
- Sales velocity: revenue produced per day by the pipeline, using the four-factor equation above.
- Pipeline velocity: often a synonym. Some teams use it for the speed at which deals move between stages.
- Deal velocity: the time one deal takes to close. It feeds the sales cycle input but ignores deal size and win rate.
Velocity measures the pace of the whole pipeline. To estimate what open deals will close this period, use a weighted pipeline in our sales forecast calculator.
Common mistakes when calculating sales velocity
- Mixing time windows: a win rate from last year, a cycle from last quarter and today's pipeline describe no real period.
- Counting unqualified opportunities: early-stage leads inflate the count and hide a lower win rate.
- Using customer lifetime value instead of ACV: renewals are not part of the sales cycle, so velocity is overstated.
- Averaging across segments: SMB and enterprise deals differ in size and cycle. Calculate each segment separately.
- Ignoring slipped deals: deals pushed to the next quarter stretch the real cycle. Refresh the inputs monthly.
From calculator to automation
From sales velocity to live attainment
A calculator gives you a snapshot. Qobra connects to your CRM, such as Salesforce or HubSpot, and calculates quota attainment and commissions on every closed deal, so each rep sees in real time what a deal pays.
RevOps and Finance work from the same data: attainment by rep and team, projected commissions and the payout impact of a plan change before it goes live.
See attainment and commissions live: book a demo →Attainment on every closed dealQobra reads each closed deal from your CRM and updates quota attainment for every rep and team.
What each deal pays, in real timeReps see the commission a deal earns, so they focus on the deals the plan rewards.
Plan changes tested before launchRevOps and Finance see projected commissions and the payout impact of a change before it goes live.
FAQ — sales velocity calculation
How do I calculate sales velocity?

Multiply qualified opportunities by average deal size and win rate, then divide by the average sales cycle in days. The result is revenue per day. For example, 200 opportunities × £12,000 × 30% ÷ 60 days = £12,000 per day, or £1,080,000 over a 90-day quarter.
What is a good sales velocity number?
A good sales velocity is one that grows against your own history and covers your quota. There is no universal benchmark, because velocity scales with deal size and team size. Track it by quarter, by segment and per rep, against quota.
How can I improve sales velocity?
Add qualified opportunities, raise average deal size, lift win rate or shorten the sales cycle. The cycle has a slightly stronger effect: cutting it by 10% raises velocity by 11.1%, while a 10% gain on another lever adds 10%. Improving all four by 10% raises velocity by 47.9%.
What is the difference between sales velocity and pipeline velocity?
Most teams use the two terms as synonyms for the revenue per day produced by the pipeline. Some use pipeline velocity for the speed at which deals move between stages. Pick one definition and apply it to every team and every report.
How often should I calculate sales velocity?
Calculate it monthly to follow trends and quarterly to plan. Monthly figures show whether pipeline, deal size, win rate or cycle are drifting. Quarterly figures, based on 6 to 12 months of history, are stable enough to set quotas and budget commissions.
Should I use ACV or customer lifetime value in the formula?
Use annual contract value (ACV), or first-year revenue for non-subscription deals. The sales cycle measures the time to win the first contract, so the value should match that contract. Lifetime value adds renewals that depend on retention, not on the sales cycle, and overstates velocity.
Can I calculate sales velocity in Excel or Google Sheets?
Yes. Enter opportunities, average deal size, win rate and cycle days in cells B1 to B4, then use =(B1*B2*B3)/B4, with the win rate formatted as a percentage. This calculator runs the same math and adds quota coverage, lever scenarios and a CSV export.
How does sales velocity relate to quota and commissions?
Sales velocity shows what a team can realistically close, so it is a check on quota. Multiply velocity per rep by the days in the period to get capacity and compare it with quota. Commissions follow closed revenue, so faster velocity also raises variable pay.


.webp)


