Sales Compensation Software Benchmark
Download

Sales Commission Calculator

Model your commission plan in real time. Set your quota, tiers, cliff and accelerators, see your commission, OTE achievement and marginal rate update instantly.
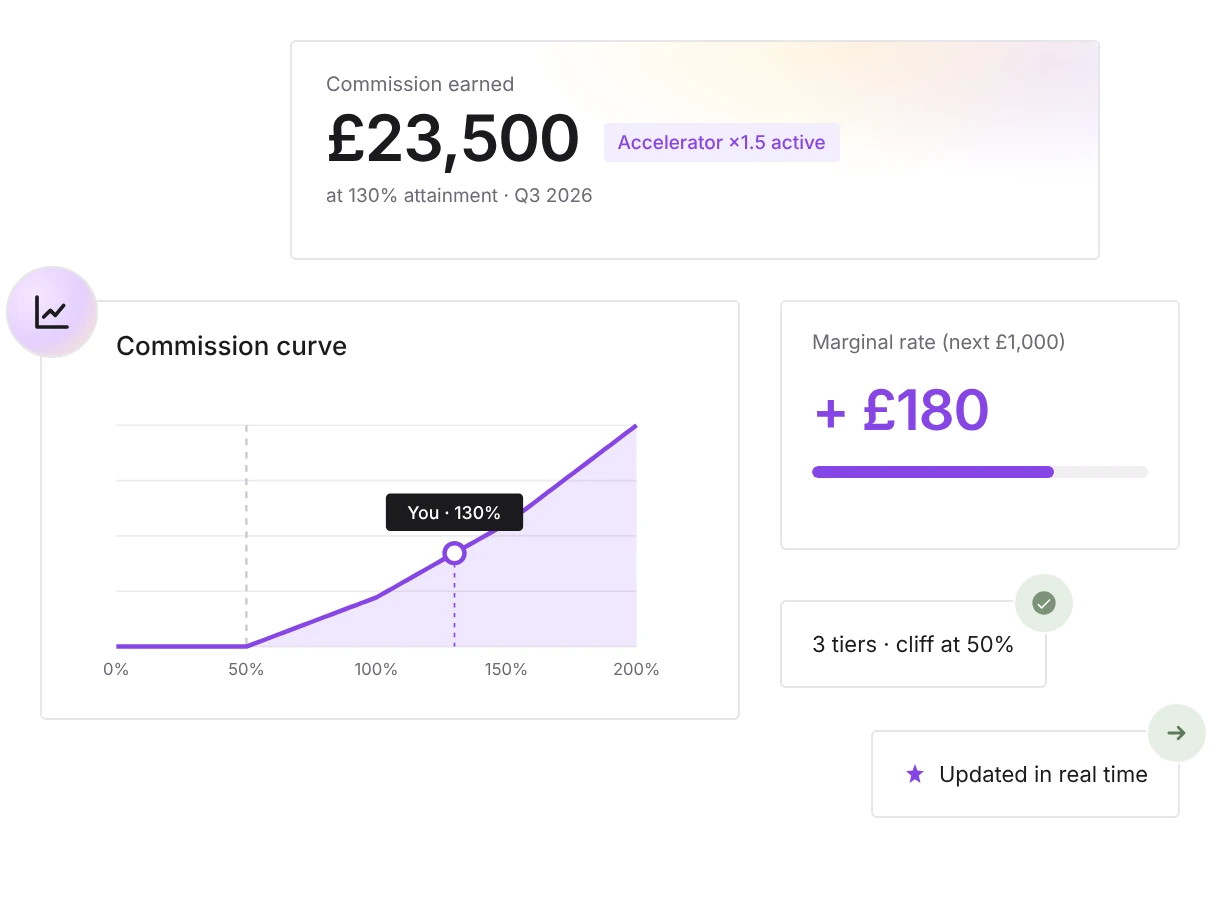
Commission calculator UI showing £23,500 commission earned at 130% attainment in Q3 2026 with Accelerator x1.5 active. A commission curve graph highlights progress at 130% with tiers from 0% to 200%. Marginal rate for next £1,000 is £180, with a progress bar. Text mentions 3 tiers with a 50% cliff and a note that data updates in real time.

How It Works

Three steps to model your commission plan in real time. No signup, no spreadsheet.

01. Pick your role

Account Executive, SDR, or Customer Success Manager. Each persona ships with realistic defaults (OTE, quota period, tier shape) that you can tweak to match your plan.

02. Set your plan structure

Quota, period, attainment, cliff, tiers, accelerators, decelerators, and cap. Add up to five tiers and three accelerator brackets. Toggle ramp-up for new joiners.

03. Read your numbers

See your commission, % of OTE achieved, effective rate, and marginal rate, and what your next £1,000 closed earns at your current attainment. The commission curve shows your full plan; the breakdown shows which tier each pound came from.

What You Can Model

Every variable that matters in a real commission plan: tiers, cliffs, accelerators, decelerators, caps, and ramp-up.

Tiered or flat plans
Up to five tiers, each with its own rate, the classic 5% / 8% / 12% / 15%+ shape, or any custom split. Or a single flat rate above the cliff for SDR-style plans.
Cliff (threshold)
The minimum attainment below which commission is zero. Common: 50% for AEs, 70-80% for SDRs, 80-90% for CSMs. Set to 0% to disable.
Accelerators
Multiply the marginal rate above a threshold, ×1.5 at 100%, ×2 at 150%. The commission curve bends visibly at each accelerator level.
Decelerators
The mirror of accelerators, multiply the rate downward below a threshold. Less common but useful for protect-renewal CSM plans.
Cap & ramp-up
Hard ceilings on commission expressed as % of variable OTE. Optional ramp-up (50% / 75% / 100%) for new joiners' first three months.
Qobra | Commission Calculator

Commission Calculator

Model any sales commission plan in seconds. AE, SDR, or CSM.

Plan basics

Plan structure

From %To %Rate %
From att. %Multiplier ×
Below att. %Multiplier ×
Commission earned
-
This period
% of variable OTE
-
-
Effective rate
-
Commission / revenue
Next 1,000 closed earns
-
Marginal rate at current attainment

Commission curve

Tier breakdown

TierRevenue bandEffective rateEarned

Tier progression

From calculator to automation

From Calculator to Commission Automation

You just modelled your commission plan. But the calculator can't actually pay your reps. It can't sync deals from Salesforce in real time, can't handle clawbacks when a deal churns, and can't give every rep on your team live visibility into what they've earned this quarter.

Sales commission software is what bridges that gap. Qobra plugs into your CRM and your payroll system, automates every commission calculation, gives every rep a real-time dashboard, and shaves dozens of hours per quarter off your Ops team's workload, with 98% accuracy versus the 92% industry baseline.

92 → 98%

Commission accuracy moving from spreadsheets to sales commission software (Gartner study).

40 hrs

Quarterly time saved on commission ops with automation (Forrester benchmark).

0

Disputes, reps who see live commissions trust the number, no more shadow accounting.

Your frequently asked questions

Sales commission is typically calculated as a percentage of the revenue (or units) a rep generates, applied above a minimum performance threshold (the 'cliff') and often broken into tiers with different rates. The total commission is the sum of (revenue in tier × tier rate × any accelerator) for each tier the rep's performance reaches. Caps and clawbacks may also apply.

A tiered structure pays different commission rates at different levels of attainment. For example: 5% on the first 50% of quota, 8% from 50–100%, 12% above 100%. Tiers reward reps for crossing meaningful thresholds, usually 50%, 80%, 100% and 130% of quota.

A cliff (also called a threshold) is the minimum attainment a rep must hit before earning any commission. A 50% cliff means a rep at 49% attainment earns 0; at 51% they earn commission on the slice from 50% to 51% only (and so on into the tiers). Common cliffs: 50% for AEs, 70–80% for SDRs, 80–90% for CSMs.

An accelerator multiplies the commission rate above a certain attainment level, typically at or above 100% of quota. A 1.5× accelerator on top tier means every pound above the threshold pays 1.5× the base rate. Accelerators reward overperformance and keep top reps engaged late in the quarter.

The marginal rate is what the next unit of revenue earns at your current attainment. If you're at 100% attainment with a ×1.5 accelerator above 100%, your marginal rate is your tier rate × 1.5, every additional £1,000 closed earns you more than the previous £1,000. This calculator highlights it because it's the single most actionable number for any sales rep mid-period.

Toggle 'Ramp' to apply a reduced multiplier for the first three months of a new rep's tenure (default 50% / 75% / 100%). This models the typical ramp curve where new reps aren't expected to hit full quota immediately and earn a guaranteed share of variable OTE while ramping.

No. Your inputs stay in your browser's localStorage only; nothing is sent to a server. Use 'Copy shareable link' to encode your scenario into a URL that you can share or bookmark.

Very accurate for the modelled scenario, but your real plan may include nuances this tool doesn't capture: per-deal-type rates, regional adjustments, contests, SPIFFs, mid-quarter quota changes, clawbacks on churned deals, or advance/draw structures. Use this as a baseline; for live, accurate, real-time commission tracking across complex plans, you want Qobra's automation platform.
01
02
03
04
White stylized letter G with a superscript 2 inside a solid orange circle.
4.8/5
with 1,000+ reviews
View all customer stories
“I would say the tooling is very simple. You can see where the variables are coming from, so it was very easy and quick for our team.”
Jessica Ho, RevOps Manager at ElevenLabs
Watch the ElevenLabs story
“Since we’ve had Qobra, we’ve seen between 15 and 20% progress towards our objectives.”
Fabian Q. Veit, CEO at Make
Watch the Make story
“It’s more the fact that I just don’t have to worry about commissions anymore.”
Chris Cook, RevOps Director at GoCardless
Watch the GoCardless story
“At the end of every period, when we run commissions right now, we do a simple check with our finance team, and that’s it.”
Derek Boelig, VP RevOps at DataSnipper
Watch the DataSnipper story