Sales Compensation Software Benchmark | Compare 15+ sales compensation platforms (features, pricing, fit by company size...)
Download
- Comp sales (same‑store sales) measure year‑over‑year revenue growth for locations open in both periods, isolating organic performance by excluding new or recently closed stores.
- Calculate: select identical comparable base (stores open throughout both periods), sum their sales for each period, then Comp Growth (%) = (Current Comp Sales − Prior Comp Sales) / Prior Comp Sales × 100; adjust for remodels, relocations, seasonality and calendar shifts.
- Interpret by decomposing drivers: Comp Growth ≈ Traffic Growth + Average Check Growth — rising traffic signals market share gains, while rising checks reflect pricing/upsell or product mix changes (watch for trade‑offs).
- Report smartly: run comp sales monthly/quarterly, segment by region/store type/product, document methodology in disclosures, and normalize for one‑offs to enable fair benchmarking and investor clarity.
- Know the limits and complement it: comp sales ignore new‑store performance and profitability and can be manipulated; pair with sales per sq. ft., gross margin/GMROI, traffic/conversion/AOV, and CAC/LTV to guide operational fixes and expansion decisions.
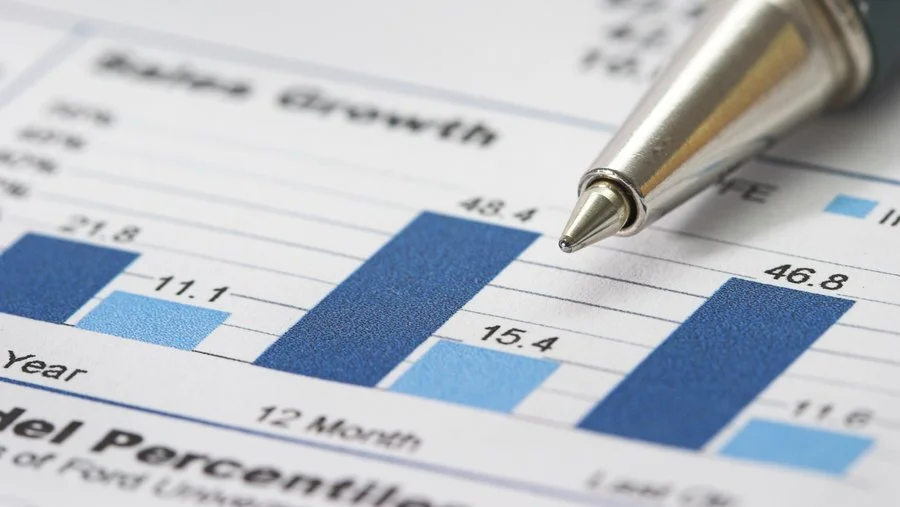
Your total revenue is climbing quarter after quarter. Does that automatically mean your business is healthy and your strategy is working? Not necessarily. Growth driven solely by opening new locations can mask underlying problems in your core business. To truly understand your company's performance, you need to look deeper and isolate the growth of your established stores. This is where comparable sales come in.
What Are Comp Sales (Comparable Store Sales)?
Comparable store sales, often shortened to "comp sales," are a key performance indicator (KPI) used primarily in the retail and restaurant industries to measure revenue growth at existing locations over a specific period. Also known as "same-store sales" or "identical-store sales," this metric compares the revenue from stores that have been open for a significant period (typically at least one year) against the revenue they generated in a similar period in the past.
The core purpose of tracking comp sales is to provide a clear picture of a company's organic growth. By excluding the revenue from newly opened or recently closed stores, analysts and managers can differentiate between growth that comes from expansion (opening new outlets) and growth that comes from improved operations at existing locations.
A positive comp sales figure indicates that established stores are performing better, suggesting an increase in customer traffic, higher spending per customer, or both. Conversely, a negative figure signals a decline in performance at the core of the business, which might require immediate attention.
Why Are Comp Sales a Critical Retail and Restaurant Metric?
Looking beyond total revenue to focus on comparable sales provides invaluable insights for managers, investors, and strategists. This metric is not just a number; it's a reflection of a company's fundamental health and operational effectiveness.
A True Indicator of Core Performance
Comp sales act as a health check for your established business. A steady increase suggests that your marketing strategies, merchandising, customer service, and operational efficiencies are resonating with your customer base. It shows you're not just growing by adding more stores, but by making your existing ones better. This is a sign of sustainable growth, which is crucial for long-term success. Properly measuring sales performance is the first step to improving it.
Boosting Investor Confidence
For publicly traded companies, comp sales are one of the most closely watched figures by investors and analysts. A consistent track record of positive comp sales growth can significantly boost investor confidence, as it demonstrates the company's ability to generate more revenue from its existing asset base. It signals financial stability and strong growth potential, often leading to a positive impact on stock prices.
Sharpening Operational Focus
By tracking this metric, management can shift its focus from relying solely on expansion to improving the operations of current locations. It highlights the importance of customer retention, menu or product optimization, and marketing campaigns designed to drive repeat business. When comp sales are down, it's a clear signal to diagnose issues at the store level—whether it's a problem with staffing, inventory, or local competition.
Informing Strategic Decisions and Benchmarking
Comp sales provide a reliable benchmark for comparing performance across different locations or against industry averages. This helps companies identify underperforming stores and develop targeted strategies to improve them. Furthermore, the data can inform critical strategic decisions, such as whether to accelerate expansion, invest in remodeling existing stores, or refine the overall brand proposition.
How to Calculate Comparable Sales: The Formula and Adjustments
Calculating comp sales might seem straightforward, but precision is key, especially when dealing with a changing store portfolio. The calculation requires careful filtering to ensure you're comparing "apples to apples."
The Basic Formula
Comp Sales Growth (%) = [ (Current Period Comp Sales - Prior Period Comp Sales) / Prior Period Comp Sales ] x 100
For this formula to be meaningful, the "Comp Sales" figures for both periods must be calculated from the exact same set of stores.
Defining the "Comparable Base" and Making Adjustments
The most critical part of the calculation is determining which stores qualify for the "comparable base." A store is typically considered comparable once it has been open for a full year (or sometimes 13 months) to allow for a clean year-over-year comparison that isn't skewed by a grand opening's initial sales spike.
Here is a step-by-step guide to calculating comparable sales accurately, especially when stores have opened or closed:
- Define Your Periods: Select the two periods you want to compare (e.g., Q2 2024 vs. Q2 2023).
- Identify the Comparable Store Base: Create a list of all stores that were open throughout both full periods. Any store that opened or closed at any point during this time frame is excluded.
- Calculate Total Sales for the Base in the Prior Period: Sum the net sales from only the comparable stores for the past period (e.g., Q2 2023).
- Calculate Total Sales for the Base in the Current Period: Sum the net sales from the same set of comparable stores for the current period (e.g., Q2 2024).
- Apply the Formula: Use the figures from steps 3 and 4 in the basic formula to find your comp sales growth percentage.
Example Calculation in Action
| Metric | Q2 2023 | Q2 2024 |
|---|---|---|
| Total Company Revenue | $15,000,000 | $18,000,000 |
| Revenue from stores opened in the last 12 months | N/A | $2,500,000 |
| Revenue from stores closed in the last 12 months | $1,000,000 | N/A |
| Revenue from the comparable store base | $14,000,000 | $15,500,000 |
First, looking at total revenue, the growth is (£18M - £15M) / £15M = 20%. This looks great on the surface.
However, to find the comp sales growth, we use only the revenue from the comparable base:
- Current Period Comp Sales: £15,500,000
- Prior Period Comp Sales: £14,000,000
Comp Sales Growth = [(£15,500,000 - £14,000,000) / £14,000,000] x 100 = 10.7%
This reveals that while the company grew by 20% overall, half of that growth came from new stores. The core business grew at a healthy but more modest 10.7%.
A Note on Consistency
Companies can define their "comparable base" differently. Some may exclude stores that underwent significant remodeling or relocation. When analyzing a company's financial reports, always check the footnotes to understand how they define and calculate same-store sales to ensure you're making a fair assessment.

Interpreting Comp Sales: What the Numbers Really Mean
A single comp sales percentage tells a story, but understanding the plot requires looking at the contributing factors. Positive, negative, or flat results can stem from very different sources, and diagnosing the "why" is essential for taking the right action.
A positive comp sales figure is a clear sign of health. It means the retailer is successfully attracting more customers, encouraging them to spend more, or both. This growth could be attributed to:
- Effective Marketing and Promotions: Successful campaigns are driving traffic and sales.
- Product/Menu Optimization: New offerings or improved merchandising are resonating with customers.
- Enhanced Customer Experience: Better service or store ambiance is fostering loyalty and repeat business.
- Price Increases: Strategic pricing changes can lift sales, though this must be balanced against potential traffic loss.
Conversely, sustained negative comp sales are a major red flag. This indicates a decline in demand or operational effectiveness at existing locations. Potential causes include increased competition, ineffective marketing, poor inventory management, a declining customer experience, or broader economic downturns affecting consumer spending.
Beyond the Single Number: Comp Sales in Context
While powerful, the top-line comp sales figure is just the beginning of the analysis. To get actionable insights, you need to deconstruct the number and view it alongside other critical sales and marketing KPIs.
Deconstructing Comp Sales: Traffic vs. Average Check
Comp Sales Growth ≈ Traffic Growth + Average Check Growth
Understanding which of these levers is driving your results is crucial.
- Growth from Traffic: This is often the healthier sign. It means you are attracting more people to your stores, expanding your customer base, and winning market share.
- Growth from Average Check: This is also positive, indicating successful upselling, effective promotions, or price increases. However, if traffic is flat or declining while average check is up, it could be a warning sign that you are becoming too expensive for your core customer base.
Industry Nuances: Retail vs. Restaurants vs. E-commerce
The application of comp sales varies slightly by industry:
- Retail: Success is heavily influenced by foot traffic, merchandising effectiveness, inventory turnover, and pricing strategies. Segmenting comp sales by store format (e.g., outlet vs. flagship) or product category can provide deeper insights.
- Restaurants: Performance is driven by guest counts (traffic) and average check, which is influenced by menu pricing, product mix, and upselling. Loyalty programs and delivery services are increasingly important drivers.
- E-commerce: The "store" is the website. Comparable sales are measured year-over-year for the same digital channel. The key drivers are sessions (traffic), conversion rate, and Average Order Value (AOV). A "new store" could be analogous to launching a new regional website or a mobile app.
Expert Tip: Segment Your Data for Deeper Insights
Don't stop at the company-wide comp sales figure. Segment your data by region, store type, or even by individual product categories. This can help you identify pockets of strength and weakness. Perhaps one region is outperforming due to a successful local marketing campaign, or a new product line is driving growth across all stores. This level of detail is essential for building an effective sales reporting structure.
Limitations and Alternatives to Comp Sales
Despite its importance, the comp sales metric has limitations and should not be used in isolation. A savvy manager or analyst will use it as part of a broader dashboard of KPIs.
Common Limitations
- It Ignores New Stores: For a company in a heavy growth phase, comp sales completely overlook the performance of new locations, which are a key part of its future success.
- It's a Revenue, Not Profit, Metric: A company could drive high comp sales through aggressive discounting, which could destroy its profit margins.
- It Can Be Manipulated: Companies can change their definition of what constitutes a "comparable" store to present their results in a more favorable light.
- It's Affected by External Factors: Calendar shifts (like a 53rd week in a fiscal year), holidays, and even weather can skew year-over-year comparisons.
Complementary Metrics to Consider
To get a holistic view of business health, pair your comp sales analysis with other metrics:
- Sales per Square Foot: Measures the efficiency and productivity of your retail space.
- Gross Margin and Gross Margin Return on Investment (GMROI): Track profitability to ensure sales growth is not coming at the expense of margins.
- Customer Acquisition Cost (CAC) and Customer Lifetime Value (LTV): Essential for understanding the long-term sustainability of your business model. You can learn more about how to calculate and use customer acquisition cost.
- Total Sales Growth: Always keep an eye on the big picture of overall expansion.
Ultimately, motivating your sales teams is a key lever for improving performance in any store, new or old. Providing them with clear goals and transparent, real-time feedback on their earnings can have a direct impact on sales outcomes. Platforms like Qobra automate commission calculations and give sales reps full visibility into their performance, eliminating disputes and boosting motivation—a critical ingredient for driving positive comp sales.
Comparable store sales remain an indispensable tool for gauging the true health of a retail or restaurant business. It cuts through the noise of expansion to reveal the underlying performance of the core operation. By calculating it accurately, deconstructing its drivers, and using it in conjunction with other key metrics, you can make smarter, more informed decisions that lead to sustainable, profitable growth.
Frequently Asked Questions
What is the difference between comp sales and total sales?
Total sales represent the entire revenue generated by a company across all its locations, including new and recently closed stores. Comp sales, or same-store sales, only include the revenue from stores that have been open for a specified period (usually over a year), providing a measure of organic growth from the established base.
How long must a store be open to be included in comp sales?
The standard industry practice is to include a store in the comparable base after it has been open for 12 to 13 full months. This ensures that its performance is compared against a full year of its own history and avoids the initial spike in sales often associated with a grand opening.
Can comp sales be negative? What does it mean?
Yes, comp sales can be negative. A negative percentage indicates that the revenue from the established store base has declined compared to the same period in the previous year. This is often a warning sign that may point to issues like decreasing customer traffic, lower spending, increased competition, or operational inefficiencies.
Do online sales count towards comp sales?
It depends on how a company structures its reporting. Many traditional brick-and-mortar retailers report e-commerce sales as a separate channel. However, as omnichannel retail grows, some companies are beginning to include direct-to-consumer online sales in their comp sales calculations, especially if they can attribute those sales to a specific geographic area or if online orders are fulfilled by stores (e.g., "buy online, pick up in-store"). It is essential to check a company's financial disclosures to understand their methodology.