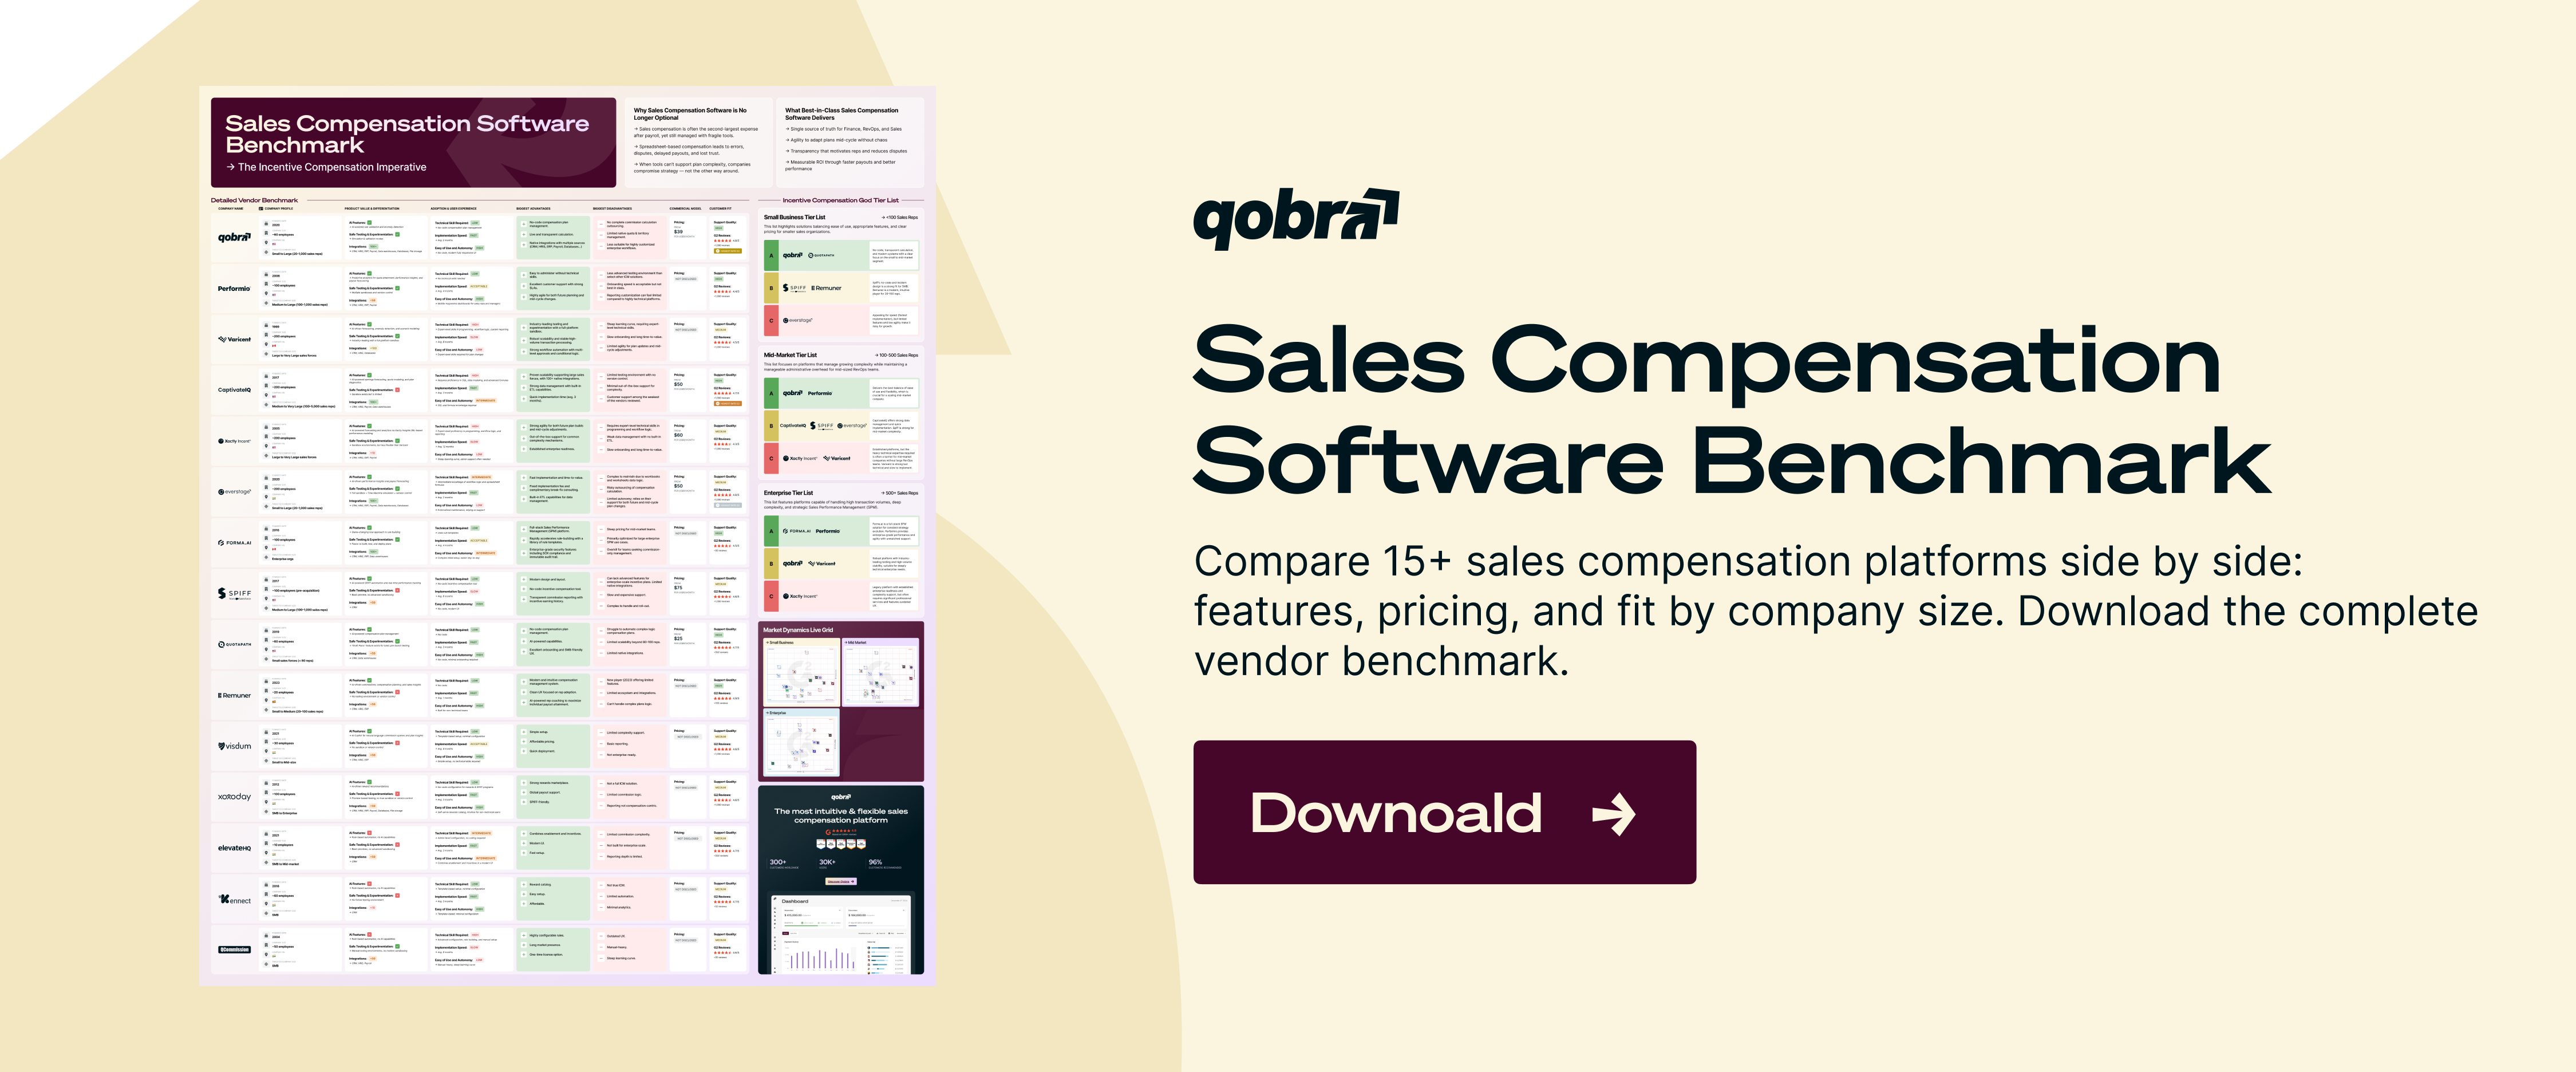
Sales Compensation Software Benchmark | Compare 15+ sales compensation platforms (features, pricing, fit by company size...)
Download
- Compa ratio compares pay to the role midpoint: Individual = (Employee Salary / Salary Range Midpoint) × 100; Group = (Sum of Actual Salaries / Sum of Salary Midpoints) × 100.
- How to calculate: (1) choose a reliable midpoint (internal band or market data) and adjust for FTE; (2) compute individual ratios for performance reviews; (3) compute group averages to spot systemic trends.
- Interpretation and actions: typical healthy bands are ~80–120% (good target ~90–110%); below-target prompts merit increases or development plans, at-target means maintain, above-target suggests non-base rewards or review for compression, and outliers (<80% or >120%) require immediate investigation.
- Strategic uses: use compa ratios for pay equity audits (compare demographics in similar roles), recruitment and retention decisions, and budget allocation—teams with low group ratios may need larger raises.
- Practical considerations and tools: rely on updated midpoints and HRIS or specialized compensation software for scale, account separately for variable pay/commissions and new/unbenchmarked roles, and provide downloadable spreadsheets/calculators and visualizations (histograms, boxplots) for operational use.
Are your employees paid fairly, and can you prove it with data? In a competitive talent market, relying on perception or gut instinct for compensation decisions is a risky strategy. It can lead to top performers resigning for better pay, teams feeling undervalued, and hidden pay equity issues that expose your business to risk.
This is where the compa ratio comes in. It's a simple yet powerful metric that acts as a compass for your compensation strategy, showing you precisely where each employee's salary stands. By moving from guesswork to a data-driven approach, you can build a pay structure that is fair, competitive, and aligned with your business goals.
What is Comp Ratio? A Key Metric for Fair Compensation
Compa ratio, short for comparative ratio, is a compensation metric that compares an individual's or a group's salary to the midpoint of a predetermined salary range. Expressed as a percentage, it instantly tells you whether an employee is paid below, at, or above your target rate for their role.
Think of it as a fairness check. A result of 100% means an employee's salary is exactly at the midpoint. A ratio below 100% means they are paid less than the midpoint, while a ratio above 100% indicates they are paid more.
This single metric is crucial for several reasons:
- It assesses pay competitiveness: It shows how your salaries stack up against your own pay structure or external market benchmarks.
- It identifies internal pay equity issues: It makes it easy to spot and investigate inconsistencies in pay between employees in similar roles.
- It informs fairer pay decisions: It provides a data-based foundation for salary adjustments, promotions, and new hire offers.
- It improves budgeting and planning: It helps you see where salary budgets need to be allocated to address retention risks or market misalignments.
Ultimately, calculating compa ratios helps you build and maintain a compensation strategy that is both sustainable for the business and attractive to current and future employees.
How to Calculate Comp Ratio: The Core Formula and Process
Calculating the compa ratio is straightforward. The logic remains the same whether you're analyzing a single employee, a team, or the entire organization.
To apply this formula effectively, you need to follow a clear, three-step process.
Step 1: Determine the Salary Midpoint
The entire calculation hinges on the salary midpoint. This figure represents the ideal or target pay for a given role, assuming a fully competent employee who meets all job expectations. The midpoint is the heart of your salary range structure.
You can source your midpoint from two primary places:
- Internal Salary Ranges: These are pay bands your organization has created based on its compensation philosophy, internal job leveling, and budget.
- Market Data: This data is sourced from external salary surveys and benchmarking tools. It reflects what other companies in your industry, location, and size are paying for similar roles.
Choosing the right midpoint is critical. Using outdated or irrelevant market data can skew your results and lead to poor decisions.
Step 2: Calculate the Individual Comp Ratio
This is the most common use of the metric, applied to evaluate a single employee's pay. It's essential for performance reviews, promotion considerations, and salary negotiations.
Let's walk through an example. Meet Alex, a Senior Account Executive at your company.
- Alex's Actual Salary: $95,000 per year.
- Salary Range Midpoint for the Role: $100,000 per year.
Now, apply the formula:
- Divide Alex's salary by the midpoint: $95,000 / $100,000 = 0.95
- Multiply by 100 to get a percentage: 0.95 x 100 = 95%
Alex's compa ratio is 95%. This means he is paid slightly below the target midpoint for his role. This could be appropriate if he is still growing into the senior position, but it also signals that he may be due for a salary increase if his performance is strong.
Step 3: Calculate the Group Comp Ratio
Analyzing the compa ratio for a group—such as a department, a team, or a specific demographic—helps identify broader trends and systemic issues. It's invaluable for budget allocation and high-level pay equity analysis.
The formula is slightly different:
Let's calculate the group compa ratio for the sales team.
Here is the calculation:
- Sum of Actual Salaries: $95,000 + $72,000 + $55,000 + $135,000 = $357,000
- Sum of Salary Midpoints: $100,000 + $75,000 + $60,000 + $130,000 = $365,000
- Divide the sums: $357,000 / $365,000 = 0.978
- Multiply by 100: 0.978 x 100 = 97.8%
The sales team's group compa ratio is 97.8%. This indicates that, on average, the team is paid slightly below the collective midpoints of their roles. This insight can help HR and finance leaders decide if the department's salary budget needs adjustment in the next planning cycle.

Interpreting Comp Ratio: What Do the Numbers Really Mean?
A compa ratio is just a number until you translate it into actionable insights. While every organization must define its own compensation philosophy, a general framework can help guide your interpretation. Most companies aim for a compa ratio range of 80% to 120%.
- Below 100% (Typically 80-99%)
- Interpretation: This is common for new hires, employees who are still developing their skills, or those with performance issues. However, if an experienced, high-performing employee falls in this range, it could signal underpayment and a significant retention risk.
- Action: For strong performers, plan for a merit increase to bring them closer to the 100% mark. For developing employees, focus on training and clear performance goals.
- At or Near 100%
- Interpretation: The employee is paid at the target market rate. This indicates they are fully proficient, consistently meeting job expectations, and valued appropriately for their role.
- Action: Maintain competitiveness with standard cost-of-living and performance-based increases.
- Above 100% (Typically 101-120%)
- Interpretation: This range is typically reserved for top performers, employees with critical or rare skills, or those with long tenure at the company. They are paid above the market midpoint due to their exceptional value.
- Action: To reward these employees without further inflating base pay, consider variable pay, bonuses, or professional development opportunities. Be mindful of potential salary compression for other team members.
- Outliers (<80% or >120%)
- Interpretation: These are immediate red flags. A ratio below 80% suggests a serious pay discrepancy and a high risk of turnover. A ratio above 120% may indicate poor budget management, pay inequity, or a "golden handcuffs" situation.
- Action: Investigate these cases immediately to understand the context and take corrective action.
Strategic Applications: Using Comp Ratio to Drive Business Goals
Calculating compa ratios is not just an administrative task; it's a strategic activity that supports broader business objectives. When used correctly, it can transform your approach to talent management.
Ensuring Pay Equity and Fairness
One of the most powerful applications of compa ratio is in pay equity analysis. By calculating and comparing ratios across different demographics (like gender or ethnicity) for similar roles, you can quickly spot potential biases. If one group consistently has a lower average compa ratio than another, it’s a clear signal to investigate your pay practices and make necessary adjustments to close any unwarranted gaps.
Enhancing Recruitment and Retention
In the war for talent, compensation is a key weapon. A strategy that keeps most employees near a 100% compa ratio demonstrates that you pay competitively. This strengthens your employer brand and makes it easier to attract top candidates. Internally, monitoring ratios helps you proactively identify flight risks. An entire team with a low group ratio is a clear warning sign that your pay may be lagging behind the market, making your employees vulnerable to poaching by competitors.
Budgeting and Compensation Planning
Group compa ratios are invaluable for strategic budget allocation. A department with an average ratio of 92% might require a larger portion of the annual salary increase budget than a department already sitting at 105%. This data-driven approach ensures that funds are directed where they are most needed to address retention risks and maintain market competitiveness, optimizing your overall compensation spend.
Beyond the Basics: Limitations and Advanced Considerations
While incredibly useful, the compa ratio is not a silver bullet. It's important to understand its limitations and how it fits into the larger compensation picture.
The standard compa ratio formula works best for base salary but can be less clear when other factors are involved:
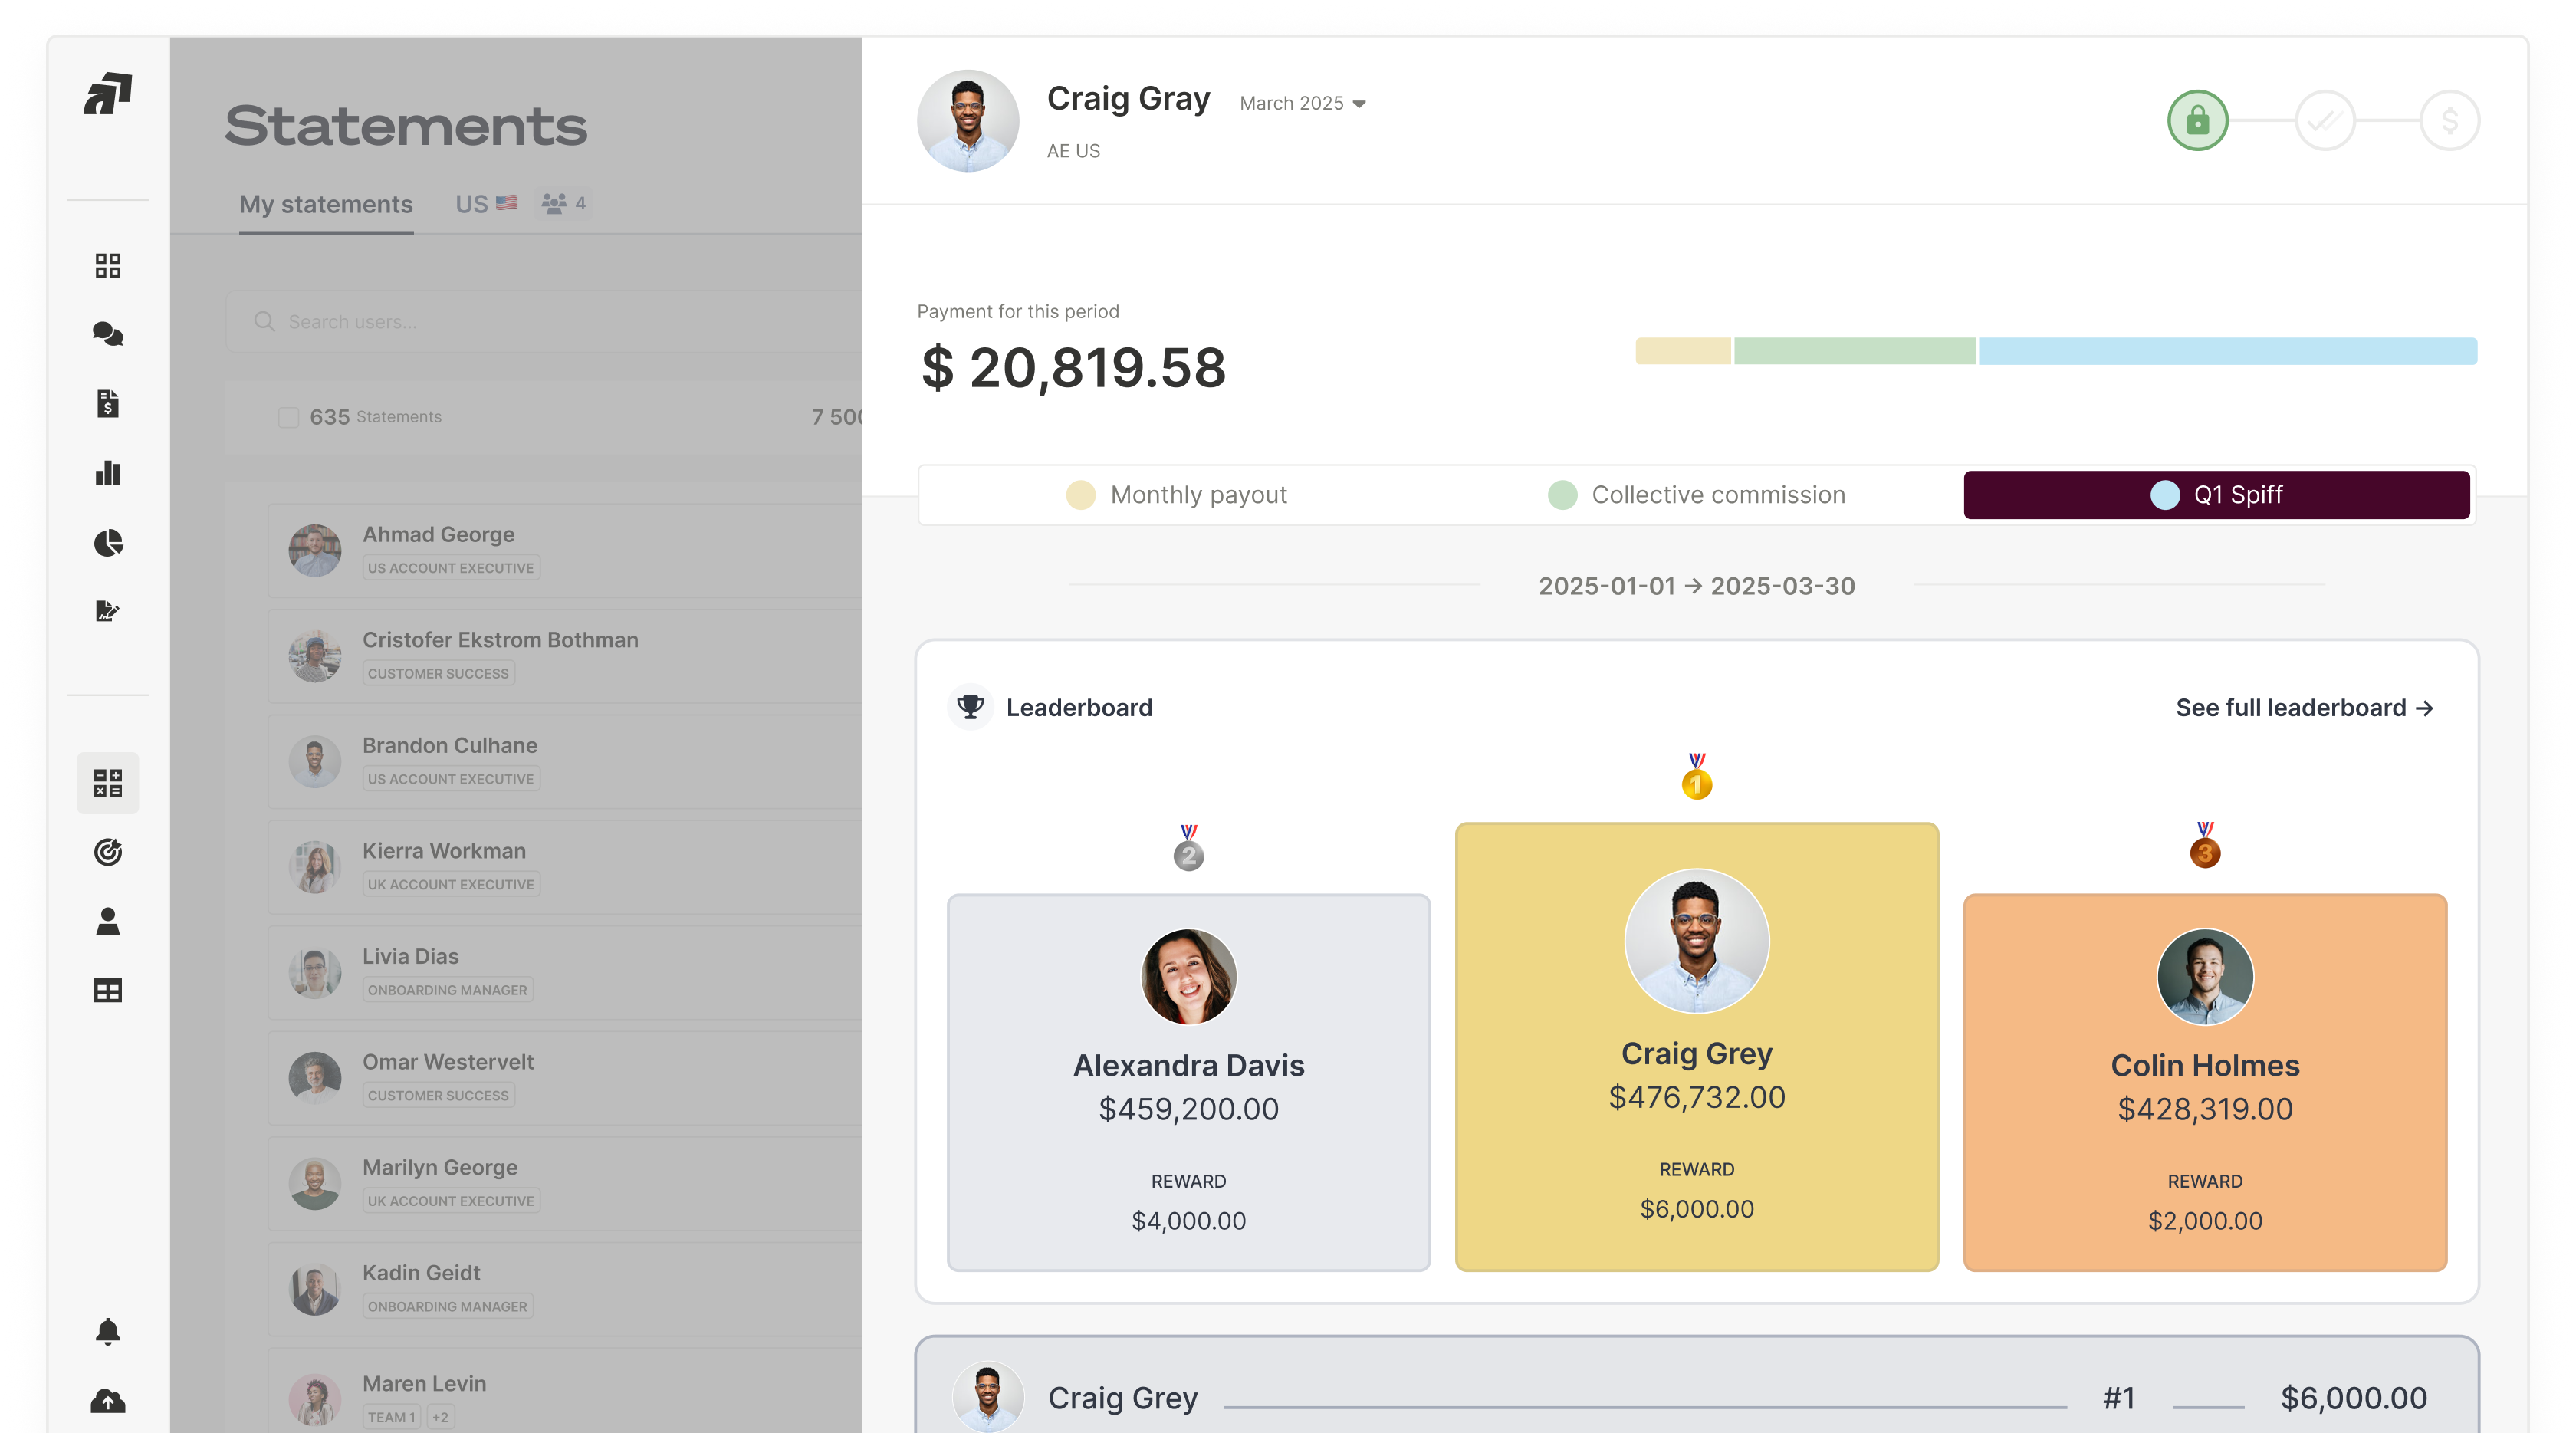
- Variable Pay and Commissions: For roles with significant variable pay, like sales, the compa ratio for base salary only tells part of the story. A salesperson might have a 90% compa ratio on their base, but their total earnings could be well over 150% of their target due to high commission payouts. For these teams, transparency in variable compensation is paramount. Automating commission calculations with a platform like Qobra provides the real-time visibility that truly motivates sales performance.
- Part-time Employees: For part-time staff, you must use their full-time equivalent (FTE) salary to ensure an accurate comparison against the role's midpoint.
- New or Unique Roles: When a role is new or highly specialized, reliable market data for a midpoint might not exist. In these cases, you may need to benchmark against similar internal roles or use a wider data set to create a proxy midpoint.
From Calculation to Action: The Right Tools for the Job
Manually calculating compa ratios in spreadsheets is feasible for small companies, but it quickly becomes cumbersome and error-prone as the organization grows. To effectively manage compensation, you need the right tools.
Most modern Human Resource Information Systems (HRIS) can store salary range data and calculate compa ratios automatically. This provides a centralized and reliable source of truth for your compensation data.
However, when managing specific and complex pay structures, specialized tools offer more power and flexibility. For instance, managing sales commissions through spreadsheets is notoriously difficult and opaque. While an HRIS handles base salary, many businesses find that dedicated software is a better fit. When reviewing your options, it's helpful to see how different solutions stack up. Reviewing in-depth analyses, like a comparison of Qobra vs. Spiff, can provide clarity on which platform best suits your need for accuracy and sales team motivation.
Adopting a robust toolset moves you from simply calculating metrics to actively managing and optimizing your entire compensation strategy.
By mastering the calculation and interpretation of the compa ratio, you empower your organization to make smarter, fairer, and more strategic decisions about its most valuable asset: its people. It's a foundational metric that, when used correctly, fosters a culture of transparency and trust, helping you attract and retain the talent you need to succeed.
Frequently Asked Questions
What is a good compa ratio?
A "good" compa ratio is typically between 90% and 110%. This range indicates that an employee is paid competitively relative to the market midpoint and their performance. However, the ideal ratio depends on the employee's experience, tenure, and performance level. A range of 80% to 120% is generally considered healthy for an organization.
How does compa ratio differ from range penetration?
Compa ratio measures a salary against the midpoint of a salary range, indicating its relation to the market target. Range penetration, calculated as (Salary - Range Minimum) / (Range Maximum - Range Minimum), measures how far an employee's salary has progressed through the entire salary range, from minimum to maximum. Compa ratio assesses market competitiveness, while range penetration assesses individual salary growth within the internal structure.
Can compa ratio be used for non-salary compensation like bonuses?
The standard compa ratio formula is designed for fixed base salary. While you could theoretically create a "total compensation" compa ratio by including bonuses, it becomes more complex. Bonuses are often variable and tied to performance, making a direct comparison to a fixed midpoint less meaningful. It's generally better to analyze base salary with compa ratio and evaluate variable pay and bonuses separately as a percentage of target earnings.
How often should we calculate compa ratios?
It's best practice to review compa ratios at least annually, typically during the annual compensation review cycle. However, they should also be calculated whenever a significant pay decision is made, such as for a new hire, a promotion, or a merit-based adjustment. For a dynamic view, organizations with integrated HR systems can monitor these ratios in real-time.