Webinar: From Running Sales Commissions to Supervising AI Agents | Thursday, August 20
Register
- Compensation analytics turns pay data into strategic decisions: define clear objectives, consolidate HRIS/payroll/market/CRM data, and pick the right tools (Excel, BI, or specialized ICM) for your needs.
- Monitor core KPIs—compa‑ratio, market index/percentiles, range penetration, total rewards, and controlled pay‑gap analyses—to assess external competitiveness, internal equity, and budget impact.
- Follow a 5‑step approach: set scope and questions, gather and clean data, choose methods/tools, run analyses (e.g., regression/outlier detection), and extract actionable insights.
- Translate insights into action: redesign salary bands, target raises by compa‑ratio and performance, optimize commission plans via CRM‑integrated ICM, and remediate inequities while protecting employee privacy.
- Start small to prove ROI: run focused pilots with existing systems, present clear “what/so‑what/now‑what” dashboards and recommendations, then scale with templates, governance, and training.
How can you be sure your company's compensation strategy is not only competitive but also fair, motivating, and aligned with your business goals? In an era where talent retention is paramount and budgets are under constant scrutiny, relying on intuition or outdated spreadsheets is no longer a viable option. The answer lies in transforming raw data into strategic intelligence through compensation analytics. This data-driven approach empowers HR and business leaders to move beyond guesswork and build reward systems that are both equitable and effective.
What is Compensation Analytics? A Strategic Lever for HR
Compensation analytics is the process of gathering, analyzing, and interpreting data related to employee remuneration to inform and guide strategic decision-making. It's about using evidence to design competitive salary structures, manage budgets effectively, ensure equitable pay practices, and ultimately, drive business performance. This practice marks a fundamental shift from reactive, administrative tasks to a proactive, strategic function within HR.
In the past, many compensation decisions were based on historical precedent or limited market surveys. Today, with improved data aggregation technologies and heightened employee expectations, there is increasing pressure to provide precise, evidence-based solutions. Compensation analytics allows organizations to answer critical questions with confidence: Are we paying enough to attract top talent? Are there pay disparities within our teams? Is our investment in variable pay yielding the desired results?
By leveraging data, organizations can optimize their compensation strategies to not only attract and retain the best employees but also to enhance job satisfaction, ensure transparency, and support compliance with ever-evolving labor regulations.
The Core Objectives of Compensation Analytics
A robust compensation analysis framework is built around several key strategic objectives. Each objective helps align your pay practices with the broader goals of the organization.
External Competitiveness
To attract and keep top performers, your compensation packages must be competitive within your industry and geographical location. Analytics helps you benchmark your salaries, bonuses, and benefits against relevant market data, ensuring you are positioned effectively to compete for talent.
Internal Equity
Fairness is a cornerstone of employee morale and retention. Compensation analytics provides the tools to scrutinize your internal pay structures for inconsistencies. It helps identify and address disparities based on gender, ethnicity, or other factors, ensuring that employees in similar roles with similar performance are paid equitably. The goal is to build trust and ensure that your policies promote fair compensation for all employees.
Budget Optimization
Compensation is often one of an organization's largest expenses. Data analytics allows you to model the financial impact of various compensation scenarios, such as annual salary increases, new bonus structures, or promotions. This ensures that every dollar spent on rewards is allocated strategically to maximize return on investment.
Performance Alignment
Effective compensation strategies do more than just reward tenure; they incentivize desired behaviors and outcomes. Analytics helps you connect pay to results, creating a clear link between employee contributions and their earnings. This is particularly crucial for sales commissions and performance bonuses, where you need to align pay with performance using a pay-for-performance model.
Key Metrics and KPIs for Your Compensation Analysis
To move from raw data to actionable insights, you need to track the right key performance indicators (KPIs). These metrics provide a clear view of the health and effectiveness of your compensation strategy.
Compensation analytics is about more than just numbers; it's about crafting a compelling narrative backed by data that you can share with leadership and employees to justify and explain remuneration decisions.
Here are some of the most critical metrics to master:
- Compa-Ratio (Compensation Ratio): This is one of the most common metrics, calculated as (Employee's Salary / Midpoint of Salary Range) * 100. A compa-ratio of 100 indicates an employee is paid exactly at the market midpoint. Ratios below 100 may suggest an employee is underpaid relative to the range, while ratios above 100 suggest they are paid above the midpoint. Analyzing compa-ratios by department, level, or demographic can reveal important trends.
- Market Index: Similar to compa-ratio, this metric compares an employee's salary to the market rate for their specific role, typically derived from external salary surveys. A market index of 1.0 means the salary matches the market average. This is crucial for gauging external competitiveness.
- Salary Range Penetration: This metric shows how far an employee has progressed through their assigned salary band. It's calculated as (Salary - Range Minimum) / (Range Maximum - Range Minimum). It helps in planning for future salary growth and identifying employees who may be nearing their pay ceiling.
- Internal Pay Equity: This involves statistical analysis to identify pay gaps between different employee groups (e.g., male vs. female, different ethnicities) after controlling for legitimate factors like role, experience, and performance. This is essential for compliance and fostering an inclusive workplace.
- Total Rewards Analysis: Compensation is more than just base salary. This analysis considers the entire value proposition, including bonuses, commissions, stock options, and benefits. This holistic view is crucial for communicating the full components of an employee's compensation and understanding its total cost and value.
| Metric | Formula | What It Measures |
|---|---|---|
| Compa-Ratio | (Salary / Midpoint) * 100 | How an employee's pay compares to the midpoint of their salary range. |
| Market Index | Salary / Market Rate | How an employee's pay compares to the external market average for their role. |
| Range Penetration | (Salary - Min) / (Max - Min) | An employee's position within their salary band. |
| Pay Gap | Avg Salary Group A / Avg Salary Group B | The percentage difference in average pay between two demographic groups. |
Avoid Analysis Paralysis
While these metrics are powerful, it's important not to look at them in isolation. A low compa-ratio might be justified for a new employee, while a high one could be appropriate for a top performer with long tenure. Context is key. Start with one or two key questions and build your analysis from there.
How to Launch a Compensation Analytics Project: A 5-Step Guide
Embarking on a compensation analytics journey doesn't require a large team of data scientists. By following a structured approach, HR professionals can deliver valuable insights with minimal resources.
Step 1: Define Your Objectives and Scope
Start by asking the right questions. What business problem are you trying to solve?
- Are we losing candidates at the offer stage due to uncompetitive salaries?
- Is our bonus structure truly motivating high performance?
- Do we have an unconscious bias in our promotion and salary increase processes?
Clearly defining your primary objective will help you focus your efforts and avoid getting lost in the data.
Step 2: Gather and Clean Your Data
Your analysis is only as good as your data. Consolidate information from various sources into a single, clean dataset. Common sources include:
- Human Resource Information System (HRIS): Employee demographics, job titles, tenure, performance ratings.
- Payroll System: Base salary, bonuses, commissions paid.
- External Market Data: Salary surveys from reputable providers.
- Performance Management System: Individual and team performance metrics.
- CRM (for sales roles): Data on deals closed, revenue generated, and quota attainment.
Data cleaning is a critical, often overlooked step. Ensure consistency in job titles, remove duplicates, and handle missing values.
Step 3: Choose Your Tools and Methods
You don't need expensive software to get started. The right tool depends on your team's skills and the complexity of your analysis.
- Spreadsheets (Excel, Google Sheets): Perfect for beginners. You can perform basic calculations, create pivot tables, and build simple charts to analyze compa-ratios or compare departmental averages.
- Business Intelligence (BI) Tools (Tableau, Power BI): These tools are excellent for creating interactive dashboards and visualizing complex data. They allow you to "slice and dice" data to uncover deeper insights.
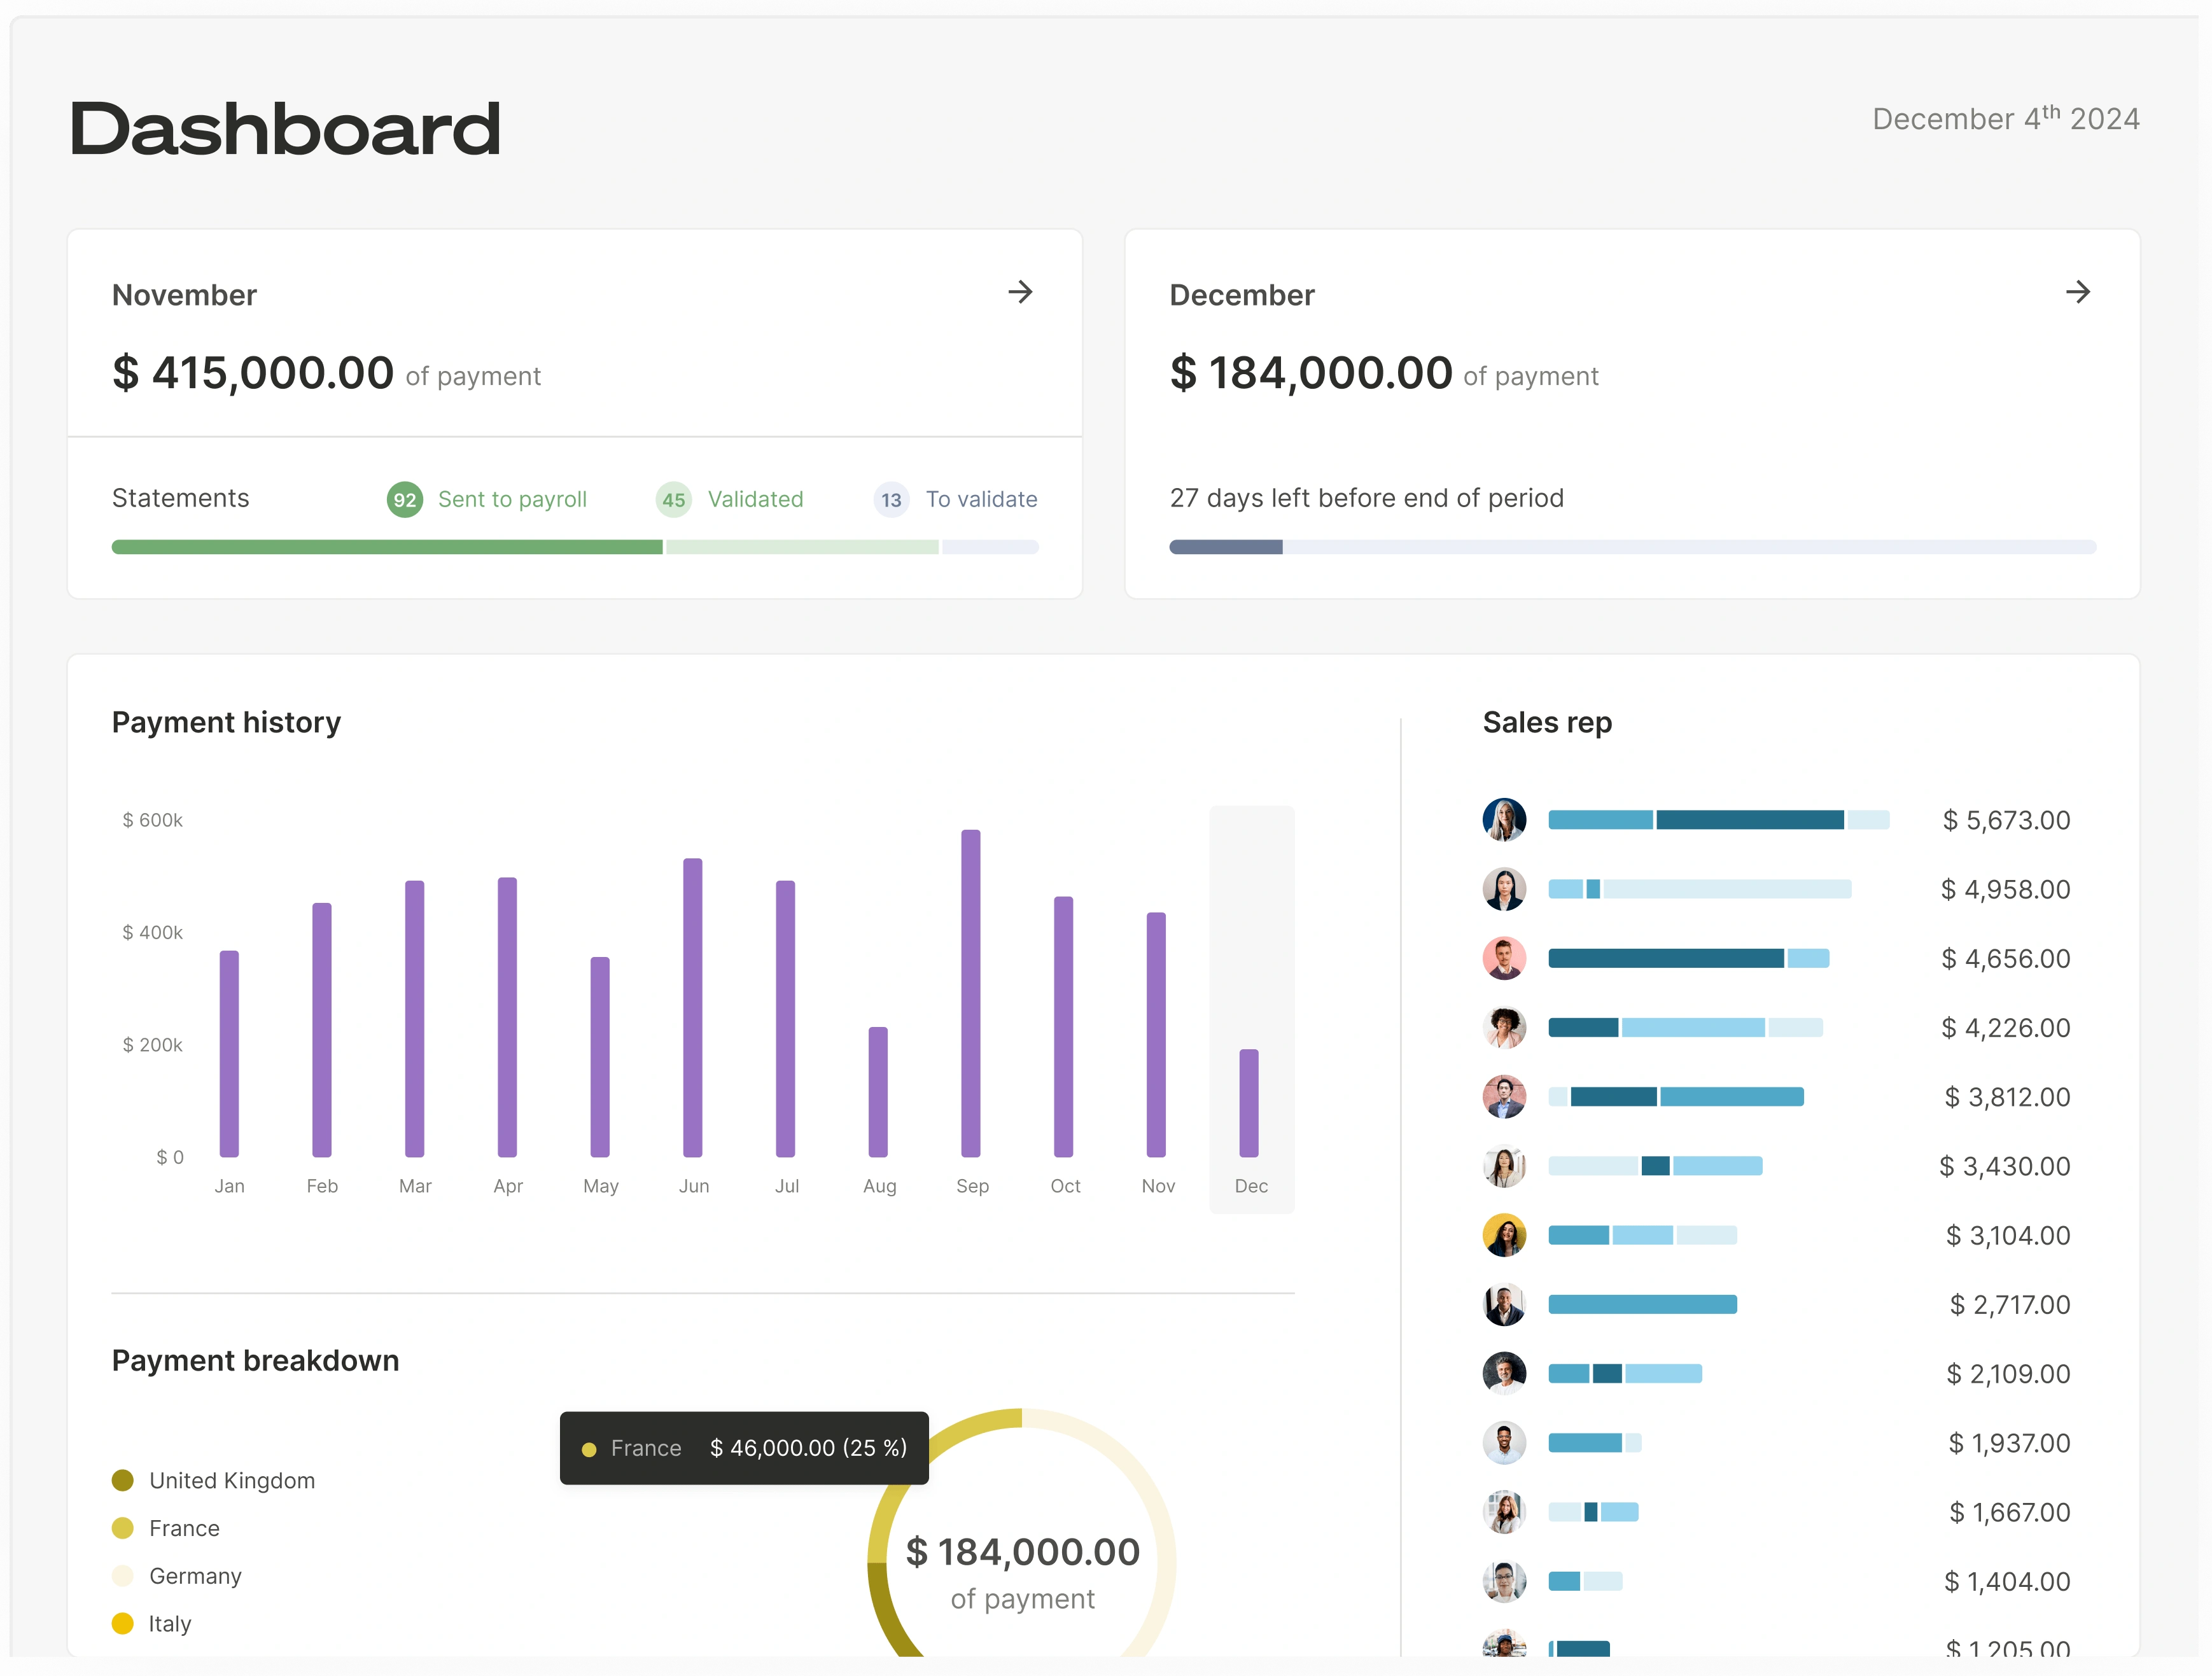
- Specialized Software: For complex areas like sales commissions, using specialized software, often called Incentive Compensation Management (ICM) tools, is a game-changer. For example, a platform like Qobra automates commission calculations by integrating directly with your CRM. It provides real-time, transparent dashboards for sales reps and managers, turning complex variable pay data into a clear, motivating tool.
Step 4: Analyze the Data and Identify Insights
With your data and tools ready, it's time to perform the analysis. Use statistical methods like regression analysis to understand the key drivers of pay in your organization. Look for trends, patterns, and outliers. For example, does performance rating have a statistically significant impact on salary increases? Are employees in a specific location consistently paid below the market index?
Step 5: Visualize and Communicate Your Findings
Raw numbers can be overwhelming. The final step is to translate your findings into a compelling story for stakeholders. Use charts, graphs, and dashboards to visualize your data. A simple bar chart showing the pay gap between two groups is far more impactful than a table of numbers. Prepare a clear report for leadership that not only presents the "what" (e.g., "we have a 5% pay gap") but also the "so what" (the risks involved) and the "now what" (recommended actions).
Expert Tip: Tell a Story with Your Data
Your audience—whether it's the CEO or a line manager—doesn't need to know the intricacies of your regression model. Frame your findings as a narrative. Start with the business problem, present the key data-driven insights that shed light on it, and conclude with clear, actionable recommendations. This approach turns your analysis from a simple report into a powerful catalyst for change.

From Insight to Action: Common Use Cases
The true value of compensation analytics is realized when insights are translated into concrete actions that improve your business.
Designing and Adjusting Salary Structures
Market data is the foundation of any competitive salary structure. Analytics helps you build logical salary bands with clear minimums, midpoints, and maximums for each job level. Regularly analyzing your market position allows you to proactively adjust these bands to ensure you remain competitive, rather than waiting for employee turnover to signal a problem.
Budgeting for Salary Increases
Instead of applying a uniform cost-of-living adjustment across the board, data can help you allocate your annual increase budget more strategically. By analyzing compa-ratios and performance data, you can prioritize raises for top performers who are paid low in their range, maximizing the motivational impact of your budget.
Optimizing Variable Pay Plans
Variable pay, especially sales commissions, is a significant investment designed to drive specific behaviors. Analytics can help you determine if your plan is working. By correlating performance data from your CRM with payout data, you can answer questions like:
- Are our top earners also our top performers in terms of revenue?
- Do our accelerators effectively motivate reps to exceed their quotas?
- Is the complexity of our plan leading to confusion and disputes?
The goal is to design an effective incentive compensation plan that truly motivates. Automating this process with a dedicated incentive compensation management solution like Qobra can eliminate errors, save hundreds of hours in manual calculations, and provide the transparency needed to keep sales teams engaged and focused on their goals.
Correcting Pay Inequities
Pay equity analysis is a critical use case. If your analysis reveals a statistically significant pay gap, you can use the data to pinpoint the root causes. Is it due to bias in starting salaries, performance assessments, or promotion decisions? Once identified, you can develop a targeted plan to remediate the disparities and implement new guidelines to prevent them from recurring.
A Note on Data Privacy
When conducting compensation analytics, especially pay equity studies, it is crucial to handle employee data with the utmost care. Anonymize data wherever possible and adhere strictly to data privacy regulations like GDPR. The objective is to analyze trends and systems, not to scrutinize individual employees.
The Compensation Analyst: The Human Behind the Data
While tools and technology are essential, the human element remains vital. The Compensation & Benefits Analyst is a key professional who orchestrates this entire process. Their role is a blend of analytical rigor and relational expertise.
On a daily basis, they analyze salary trends, manage benefits programs, collaborate with finance on budgets, and advise leadership on compensation strategies. To excel, a compensation analyst needs strong quantitative skills, a deep understanding of HR principles and labor law, and the ability to communicate complex information clearly to a non-technical audience. They are the storytellers who transform data into strategic action.
Ultimately, compensation analytics is not a one-time project but an ongoing discipline. It empowers organizations to build reward systems that are not only competitive and compliant but also fundamentally fair and motivating. By embracing a data-driven culture, you can ensure that your compensation strategy is a powerful asset that fuels growth and success. This data-driven approach is at the heart of any successful compensation transformation.
FAQ
What is the difference between compensation analytics and simple reporting?
Reporting tells you what happened (e.g., "The average salary increased by 3%"). Analytics aims to explain why it happened and predict what will happen (e.g., "The salary increase was driven by market adjustments in our engineering department, and without further action, we predict a 15% turnover rate in that team"). Analytics is forward-looking and focuses on actionable insights.
How can I ensure my data is accurate for analysis?
Data accuracy is foundational. Start by performing regular data audits in your HRIS and payroll systems. Establish clear data entry standards to ensure consistency. Where possible, integrate your systems to reduce manual entry errors. For variable pay, using a tool like Qobra that syncs directly with your CRM ensures commission calculations are based on the most up-to-date and accurate sales data.
What's the first step to take with a very limited budget?
Start small and prove the value. You don't need expensive tools initially. Use Microsoft Excel and your existing HRIS data. Focus on answering one high-impact question, such as calculating compa-ratios for a critical department or conducting a basic internal pay equity analysis. The insights from this initial project can help you build a business case for more resources.
How does compensation analytics support pay transparency?
Pay transparency is the practice of openly communicating about compensation philosophy and practices. Analytics provides the objective, data-backed rationale for your pay decisions. When you can confidently explain why a salary range is what it is (based on market data) and how an individual's pay was determined (based on their skills, experience, and performance), you build trust and perceived fairness. This is the foundation of pay transparency.