This sales forecast calculator gives you two ways to forecast sales: a weighted pipeline for the current period, and a run-rate projection with compound growth. Both answer the same questions: will you hit the number, and what will commissions cost?
01
Choose a mode and a period
Pick weighted pipeline to forecast the current period, or run-rate and growth for a longer horizon. Set the currency and whether you forecast by month, quarter or year.
02
Enter your pipeline or your revenue
List open amounts and win probabilities by stage; the five default stages are an editable example, not a benchmark. In growth mode, enter current revenue and a growth rate, or paste 3 to 12 past periods.
03
Read the gap, coverage and commission cost
Compare commit, most likely and best case against quota, check pipeline coverage, then apply an effective commission rate. Copy a shareable link or export the forecast to CSV.
What you can model
Every input of a sales forecast, from stage probabilities to commission cost, in one calculator.
01
Weighted pipeline
Add, rename or remove stages, set the open amount and win probability of each, and add the revenue already closed-won.
02
Three forecast scenarios
Set a commit threshold to split the forecast into commit, most likely and best case, side by side.
03
Gap to quota and coverage
See how far each scenario lands from quota and how many times the open pipeline covers what is left to close.
04
Growth from your history
Project a run-rate with compound growth over up to 36 periods, or derive the growth rate from your past revenue.
05
Commission cost and accuracy
Apply an effective commission rate to every scenario, then compare last period's forecast with actuals to check accuracy and bias.
Sales Forecast Calculator
Forecast the period from your weighted pipeline, or project revenue from a growth rate. Then check the gap to quota and the commission cost.
The headline figures are the most likely forecast, the gap to quota, the pipeline coverage ratio and the commission cost. The scenario table adds commit and best case, and growth mode gives a table by period with conservative, expected and aggressive projections.
Sales forecast formulas
Each sales forecast formula is shown under the results, with your own numbers.
Weighted pipeline (opportunity stage) formula
Forecast = closed-won to date + Σ (open amount in each stage × win probability of that stage). A $300,000 deal in a 60% stage adds $180,000. Across many deals, wins and losses balance out.
The three scenarios use the commit threshold. Commit adds only the weighted value of stages at or above the threshold. Most likely adds the full weighted pipeline. Best case counts commit stages at 100% and keeps the earlier stages weighted.
Run-rate and growth formula
Revenue in period n = current revenue × (1 + g)^n, where g is the growth rate per period. Growth compounds: 3% a month over 12 months lifts the monthly run-rate by about 42.6%, not 36%. The average growth rate from your history is (last period ÷ first period)^(1 ÷ (number of periods − 1)) − 1.
Gap to quota and pipeline coverage
Gap to quota = forecast − quota. Pipeline coverage ratio = open pipeline ÷ (quota − closed-won): how many times the open pipeline covers what is left to close. A high ratio built on early-stage deals can still miss.
If the quota itself looks out of reach, test it from the other side with the sales quota calculator.
Sales forecast example: a SaaS quarter
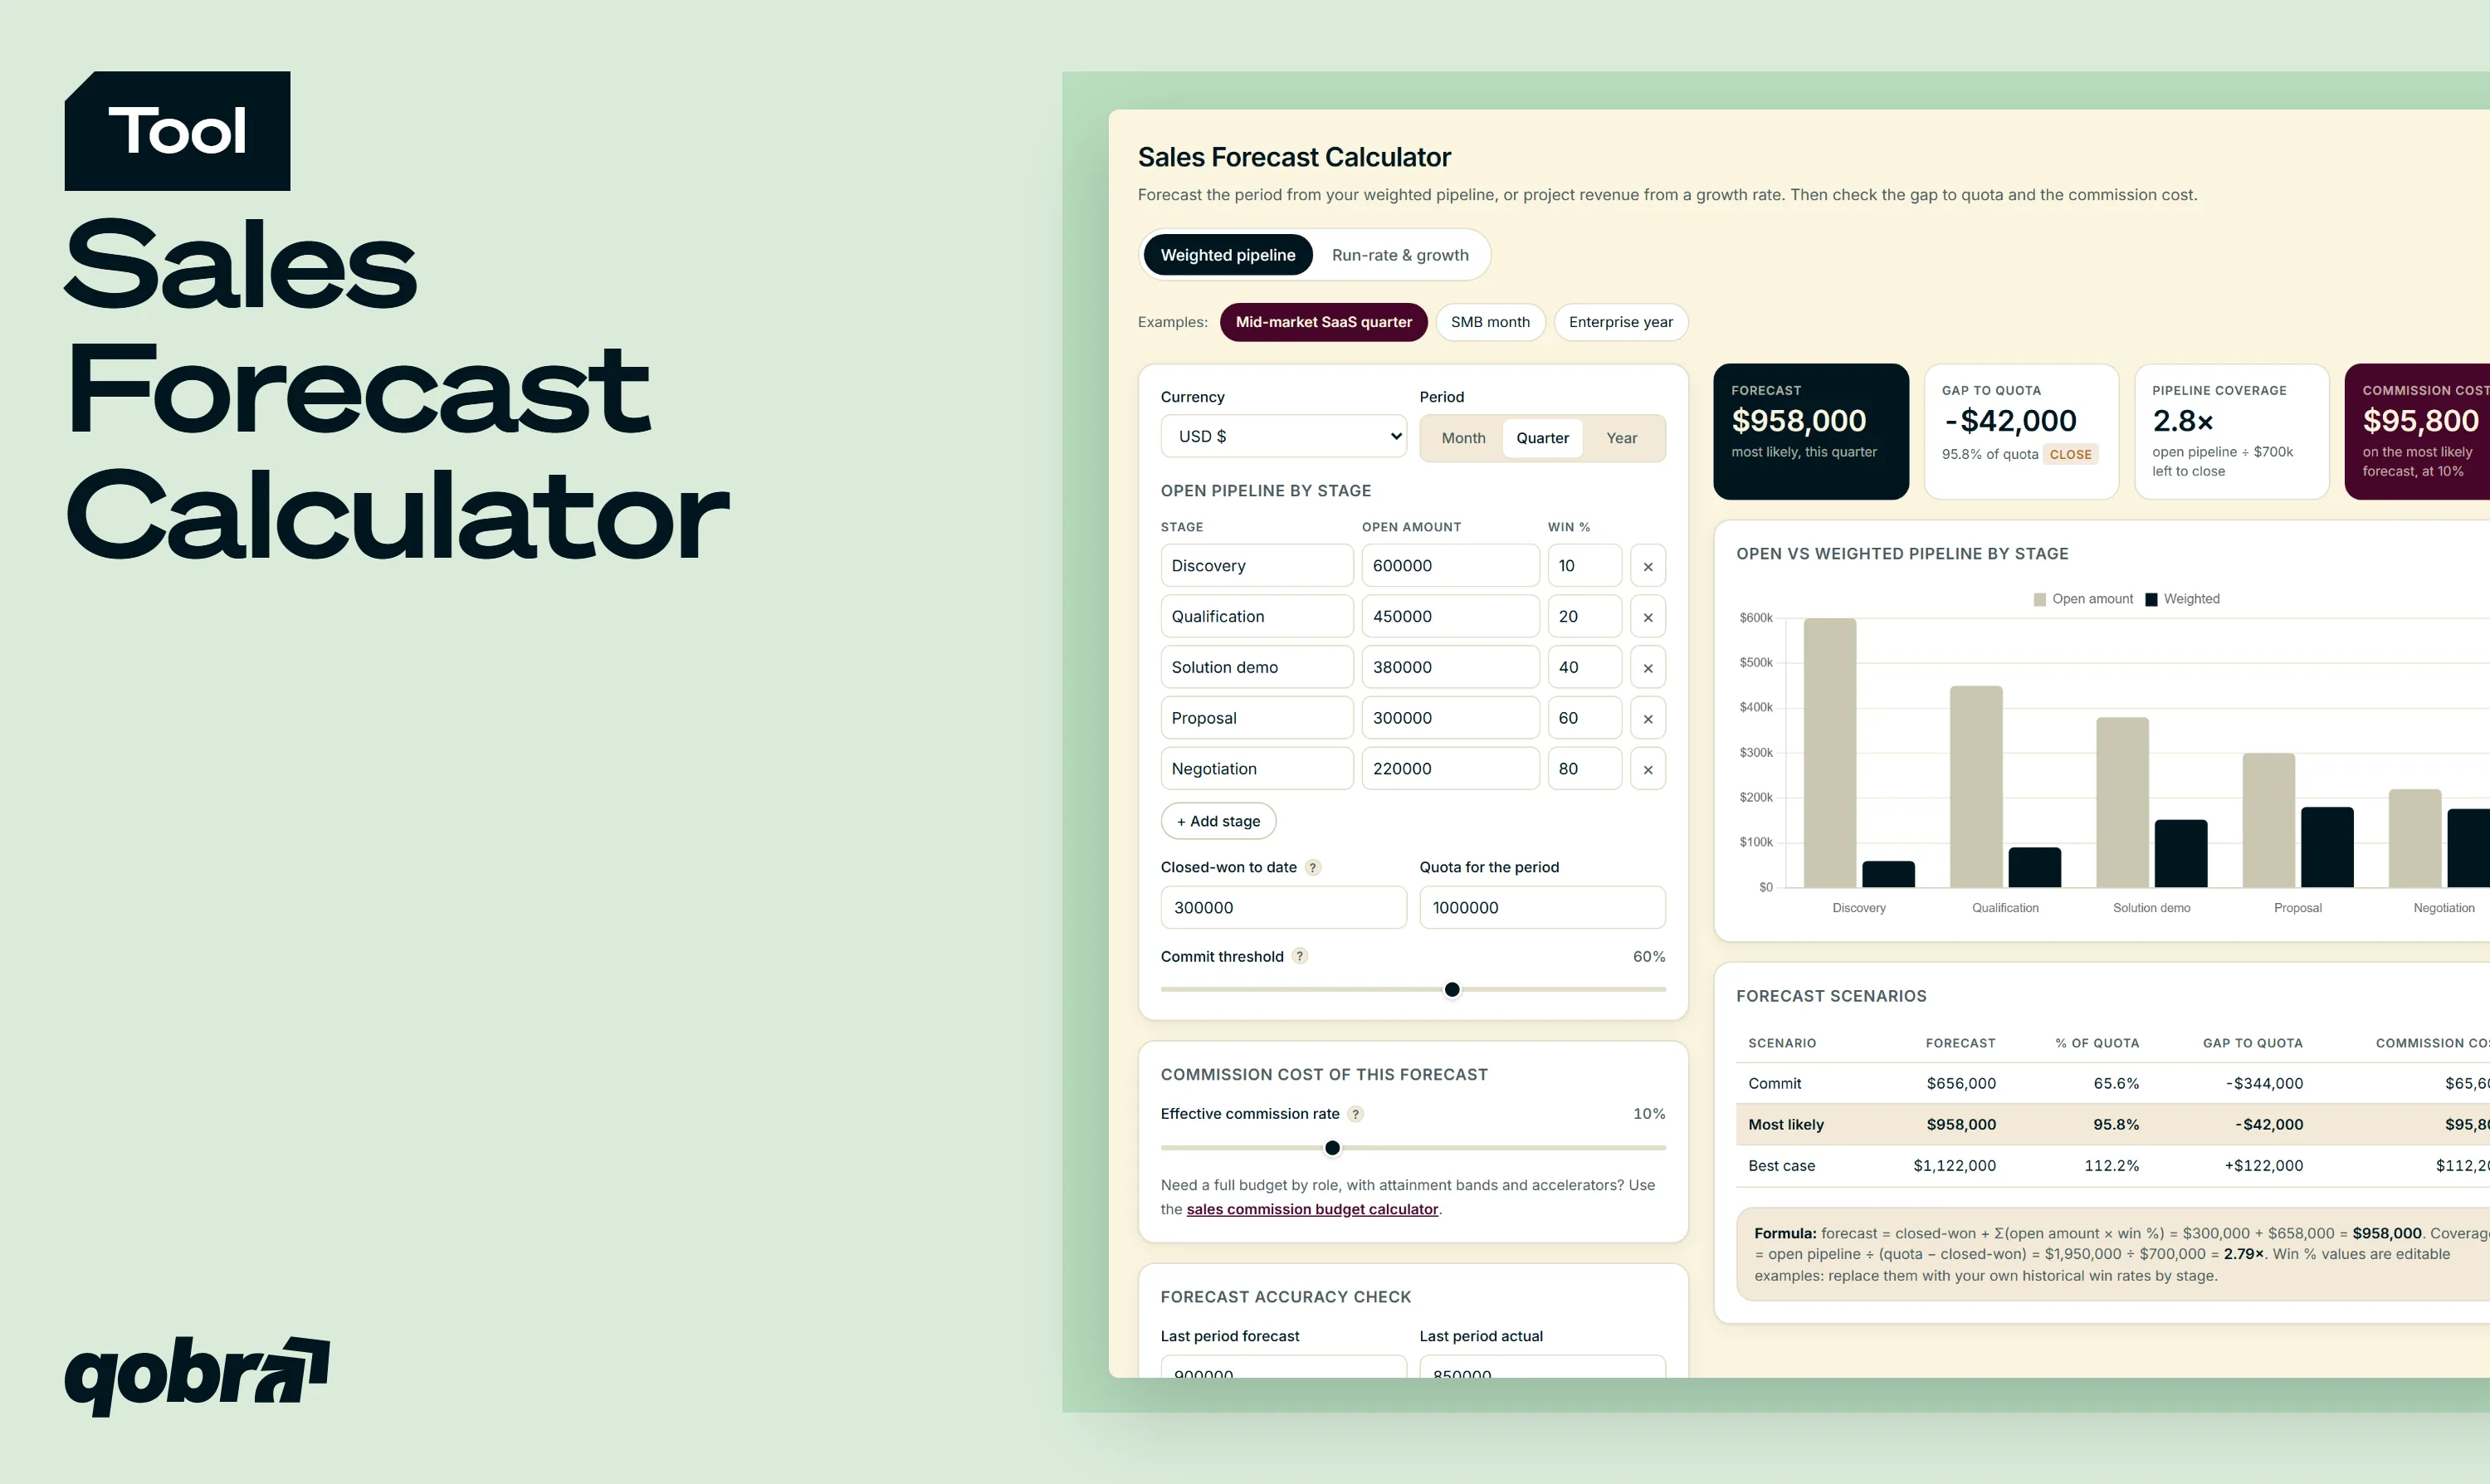
A mid-market SaaS team has a $1,000,000 quarterly quota and $300,000 already closed-won. Its open pipeline is $1,950,000, spread across five stages. These are the default values of the calculator, so you can reproduce every figure below.
Discovery: $600,000 at 10% = $60,000 weighted
Qualification: $450,000 at 20% = $90,000
Solution demo: $380,000 at 40% = $152,000
Proposal: $300,000 at 60% = $180,000
Negotiation: $220,000 at 80% = $176,000
The weighted pipeline totals $658,000. The most likely forecast is $300,000 + $658,000 = $958,000, or 95.8% of quota: a gap of $42,000. With $700,000 left to close, pipeline coverage is $1,950,000 ÷ $700,000 = 2.8×.
With a 60% commit threshold, the commit forecast is $656,000 (Proposal and Negotiation weighted, plus closed-won) and the best case reaches $1,122,000. At an effective commission rate of 10%, the quarter would cost $65,600 in commissions on commit, $95,800 on the most likely forecast and $112,200 in the best case.
Same logic in growth mode: $250,000 of monthly revenue growing 3% a month reaches $356,440 in month 12 and adds up to $3,654,448 over the year, above a $3,500,000 target.
Which sales forecasting method should you use?
The best forecasting method depends on the data you trust and the horizon you need. Most B2B teams combine two.
Weighted pipeline
Needs a clean CRM with consistent stages. Best for the current month or quarter, when most of the revenue is already in the pipeline.
Run-rate and historical growth
Needs 3 to 12 periods of revenue history. Best for annual plans, budgets and hiring, beyond the visible pipeline.
Sales cycle and velocity
Needs average deal size, win rate and cycle length. Best to check whether the pipeline can close in time. The sales velocity calculator covers this angle.
AI and multivariable models add signals such as deal age or engagement, but rely on the same CRM data. For a full comparison, read our guide to forecasting techniques.
How to make your forecast more accurate
Forecast confidence is low in many teams. In a 2020 Gartner survey, only 45% of sales leaders and sellers said they had high confidence in their organization's forecasting accuracy. Three habits make the biggest difference.
Calibrate stage probabilities on your own win rates
Replace the example probabilities with your historical win rate by stage: deals that reached the stage and closed, divided by all deals that reached it. Revisit them every quarter, and split them by segment if deal sizes differ widely.
Measure sales forecast accuracy
Forecast accuracy = 1 − |forecast − actual| ÷ actual. A $900,000 forecast against $850,000 of actual revenue gives 94.1% accuracy, with a 5.9% over-forecast. Track bias too: over-forecasting and sandbagging need different fixes.
Separate commit, best case and pipeline
One number hides the risk. Commit, most likely and best case side by side show how much of the forecast depends on deals not yet in late stages.
From revenue forecast to commission forecast
A revenue forecast is also a cost forecast. Every forecast dollar that closes triggers variable pay, and Finance needs that number before payroll.
Estimate the commission cost of your forecast
Multiply each scenario by your effective commission rate: total commissions paid divided by revenue, or variable pay at target divided by quota. The calculator applies it to commit, most likely and best case. For a full budget by role, with attainment bands and accelerators, use the sales commission budget calculator.
Accruals: what Finance needs from the forecast
Commissions are often earned in one period and paid in the next. Finance books an accrued commission for the gap, and the forecast tells them how large it will be. Under ASC 606, some commissions are also capitalized and spread over the contract term, which makes an early estimate even more useful.
Forecasting in Excel vs. a calculator
A sales forecast template in Excel or Google Sheets works once the model is settled. Weighted pipeline is a SUMPRODUCT of amounts and probabilities, compound growth is =start*(1+rate)^n, and FORECAST.LINEAR fits a straight trend on past periods.
This sales forecast calculator is faster for testing assumptions: change a probability or a growth rate and every scenario updates. Then export the result to CSV and paste it into your own sheet.
From calculator to automation
From sales forecast to commission forecast, automatically
You now know what the period should bring in. The next question is what it will pay out: commissions by rep, accruals for Finance, and the earnings each seller can expect if the pipeline closes as planned.
Qobra connects to your CRM and turns deals into commissions under your real plan rules, with thresholds, accelerators and splits. Simulate commission outcomes by scenario, let reps see their forecasted earnings in real time, and give Finance accrual reports that match what will be paid.
Commission forecast by scenarioSimulate what each forecast scenario will pay out in commissions, under your real plan rules.
Forecasted earnings for every repEach seller sees in real time the earnings they can expect if the pipeline closes as planned.
Accruals Finance can trustAccrual reports built from the same deals and rules as the commissions that will be paid.
FAQ — sales forecasting
How do I calculate my sales forecast?
Add the revenue already closed to the weighted value of your open pipeline: for each stage, multiply the open amount by its win probability, then sum. For longer horizons, project your run-rate with a growth rate: revenue × (1 + growth rate)^n. A sales forecast calculator does both and shows the gap to quota.
What is the best forecasting method for sales?
It depends on your data and horizon. Weighted pipeline works best for the current month or quarter when CRM stages are reliable. Historical growth suits annual plans and budgets. Many B2B teams run both: when they disagree, the gap usually points to a pipeline or data quality issue.
How do you calculate a weighted pipeline forecast?
Multiply each open deal or stage amount by its win probability, then add the results. With $300,000 in a 60% stage and $220,000 in an 80% stage, the weighted pipeline is $180,000 + $176,000 = $356,000. Add closed-won revenue to get the period forecast. Base the probabilities on your own historical win rates by stage.
How do I calculate a sales forecast in Excel?
For a weighted pipeline, put amounts and probabilities in two columns, use =SUMPRODUCT(amounts, probabilities) and add closed-won revenue. For growth, use =start*(1+rate)^n in each period row. FORECAST.LINEAR fits a linear trend on past periods. You can also build the forecast here and export it to CSV.
Can AI be used to forecast sales?
Yes. AI models can weigh signals that a stage probability ignores, such as deal age or activity, and flag deals at risk. They still depend on clean CRM data. Most teams keep a transparent baseline, such as a weighted pipeline or run-rate forecast, to challenge what the model predicts.
What are the 7 steps of forecasting?
A common sequence: define the goal and horizon, gather historical and pipeline data, clean it, choose a method, build the forecast, review it with sales leaders, then compare it with actuals and adjust. That last step is how stage probabilities and growth assumptions improve over time.
How do you measure sales forecast accuracy?
Forecast accuracy = 1 − |forecast − actual| ÷ actual. A $900,000 forecast with $850,000 of actual revenue gives 94.1% accuracy. Also track bias, (forecast − actual) ÷ actual, to see whether the team tends to over-forecast or under-forecast. Measure it every period and by segment.
How does a sales forecast affect commission costs?
Commission costs follow the forecast. Multiply it by your effective commission rate to estimate the variable pay the period will trigger. With a $958,000 forecast and a 10% effective rate, commissions come to about $95,800. Accelerators and tiers raise the cost faster once reps pass quota, so check each scenario.



.webp)


