Webinar: From Running Sales Commissions to Supervising AI Agents | Thursday, August 20
Register
Are your sales efforts truly hitting the mark? How can you be sure your team is effective at turning potential interest into tangible revenue? The answer lies not in gut feelings or intuition, but in a clear, data-driven understanding of your performance. Measuring success is the first step toward amplifying it, but where do you even begin?
Understanding Sales Conversion Metrics
A sales conversion metric is a key performance indicator (KPI) that measures the effectiveness of your sales team at moving potential customers through the sales funnel to take a desired action. This "desired action" is the conversion. While the ultimate conversion is often a closed deal, conversions can also include smaller steps, known as micro-conversions, such as signing up for a newsletter, booking a demo, or downloading a resource.
The most fundamental of these metrics is the Sales Conversion Rate. It calculates the percentage of leads who become customers. This single figure provides a powerful snapshot of your sales process's efficiency.
The formula is straightforward:
Sales Conversion Rate = (Total Number of Sales / Total Number of Leads) x 100
For example, if your team generated 100 qualified leads in a quarter and successfully closed 27 of them, your sales conversion rate would be 27%.
(27 Sales ÷ 100 Leads) x 100 = 27%
While this primary metric is crucial, a holistic view requires tracking a broader set of indicators. Focusing solely on the final conversion rate is like only looking at the final score of a game without analyzing the plays that led to it. To truly optimize performance, you need to understand the entire customer journey.
Why Tracking These Metrics is a Game-Changer
Consistently tracking conversion metrics does more than just fill a report; it transforms your entire sales and marketing operation. It helps teams understand the real-world impact of their strategies, pinpointing what works and what needs refinement. This data-driven approach allows sales leaders to get a clear view of the company's health and identify critical areas for improvement.
One of the most significant benefits is the alignment of sales and marketing efforts. When both teams use the same metrics to define success, they can work together to attract and nurture higher-quality leads. Marketing can see which campaigns generate leads that actually convert, and sales can provide feedback on lead quality, creating a powerful feedback loop. This synergy is essential for improving the speed and efficiency of your entire sales cycle.
Furthermore, these metrics are vital for setting realistic goals and managing your sales pipeline. A team with a high conversion rate can set a lower pipeline target to hit its revenue goals, whereas a team with a lower rate knows it needs to generate a higher volume of leads. This allows for more effective sales forecasting and resource allocation.
💡 Expert Advice
Don't just track your metrics, benchmark them. While industry averages can provide some context, the most valuable benchmark is your own historical performance. Track your conversion rates month-over-month and quarter-over-quarter to identify trends, understand the impact of new strategies, and set achievable improvement goals.
12 Essential Conversion Metrics You Should Be Tracking
To gain a comprehensive understanding of your performance, look beyond the primary conversion rate. Here are 12 key metrics that offer deeper insights into every stage of your sales funnel.
- Sales Conversion Rate: As discussed, this is the master metric. It’s the ultimate indicator of your team's ability to close deals.
- Click-Through Rate (CTR): A classic micro-conversion, CTR measures the percentage of people who click on a link or call-to-action (CTA) compared to the total number who saw it. It’s a vital sign of how compelling and relevant your messaging is in ads, emails, and on your website.
- Cost Per Acquisition (CPA): This metric calculates the average cost to acquire one new customer through a specific campaign or channel. A lower CPA indicates a more efficient and profitable marketing and sales effort.
- Return on Ad Spend (ROAS): ROAS measures the total revenue generated for every dollar spent on advertising. It directly assesses the profitability of your paid campaigns and helps you allocate your budget to the channels delivering the best results.
- Average Time Spent on Site: This engagement metric indicates how compelling your website content is. A longer average time suggests that visitors find your content valuable and are more invested in what you have to offer.
- Bounce Rate: The percentage of visitors who land on a webpage and leave without taking any action. A high bounce rate can be a red flag, indicating a disconnect between your ad copy and your landing page, poor user experience, or slow page load times.
- Email Subscribers: For businesses that rely on email marketing, the number of new subscribers is a key indicator of audience growth. A healthy, growing list provides more opportunities for nurturing leads and driving future conversions.
- Cart Abandonment Rate: Crucial for e-commerce and SaaS businesses with self-service checkout, this metric tracks the percentage of users who add items to their cart but leave without completing the purchase. Reducing this rate is one of the quickest ways to boost revenue.
- Customer Lifetime Value (CLV): CLV projects the total revenue a business can expect from a single customer throughout their entire relationship. It encourages a long-term perspective, prioritizing customer retention and loyalty over short-term gains.
- Revenue to Visitor Ratio (RVR): This tells you the average amount of revenue generated for each person who visits your website. It’s a powerful measure of how effectively your site converts general traffic into paying customers.
- Social Media Engagement: Likes, shares, comments, and follows on platforms like LinkedIn, Facebook, or Instagram. High engagement indicates a strong brand community and can be a significant source of direct traffic and high-quality leads.
- Revenue and Sales: The ultimate bottom-line metrics. Tracking total revenue and the number of sales provides the clearest picture of your business's financial health and overall success.

Key Factors That Influence Your Conversion Rates
Understanding why your conversion rate is high or low is the first step toward improving it. Several critical factors can significantly impact your team's ability to turn leads into customers.
Lead Quality
Not all leads are created equal. A system flooded with a million low-quality leads can be less valuable than one with a thousand highly-qualified prospects. A low-quality lead might have incorrect information, lack buying authority, or simply not be a good fit for your product. When sales reps spend time on these unlikely prospects, they miss opportunities with those who are genuinely engaged and ready to buy. A seamless handoff between marketing (which generates Marketing Qualified Leads, or MQLs) and sales (which vets them into Sales Qualified Leads, or SQLs) is paramount for maintaining a high-quality pipeline.
The Complexity of the Buying Process
If your buying process is complicated, you will lose customers. It’s that simple. A convoluted payment system, a lengthy and confusing contract process, or a lack of clear information can cause even the most interested buyers to walk away. The key is to remove as many barriers as possible. Streamline your checkout, simplify your proposals, and make it incredibly easy for prospects to say "yes" and give you their business. Every extra click or unnecessary step is a potential exit point for a customer.
Actionable Strategies to Boost Your Sales Conversion Rate
Improving your conversion rate is an ongoing process of refinement and optimization. It doesn't require a complete overhaul overnight. Instead, focus on implementing targeted strategies that address specific weaknesses in your sales process.
Personalize Every Interaction
Generic outreach no longer cuts it. In today's market, prospects expect personalization that goes beyond using their first name in an email. The content of your message must be directly relevant to their specific needs and challenges. Reference a past conversation, share a case study from their industry, or provide content that addresses a pain point they mentioned. This shows you were listening and are genuinely invested in solving their problem, which builds trust and accelerates the sales process.
Use Data to Drive Decisions
While experience and intuition are valuable, they should never replace hard data. Use analytics tools to gain an accurate picture of where each lead stands in the funnel. Track engagement, review your pipeline dashboards regularly, and identify which outreach strategies are actually working. This data-driven approach helps you focus your efforts where they will have the most impact.
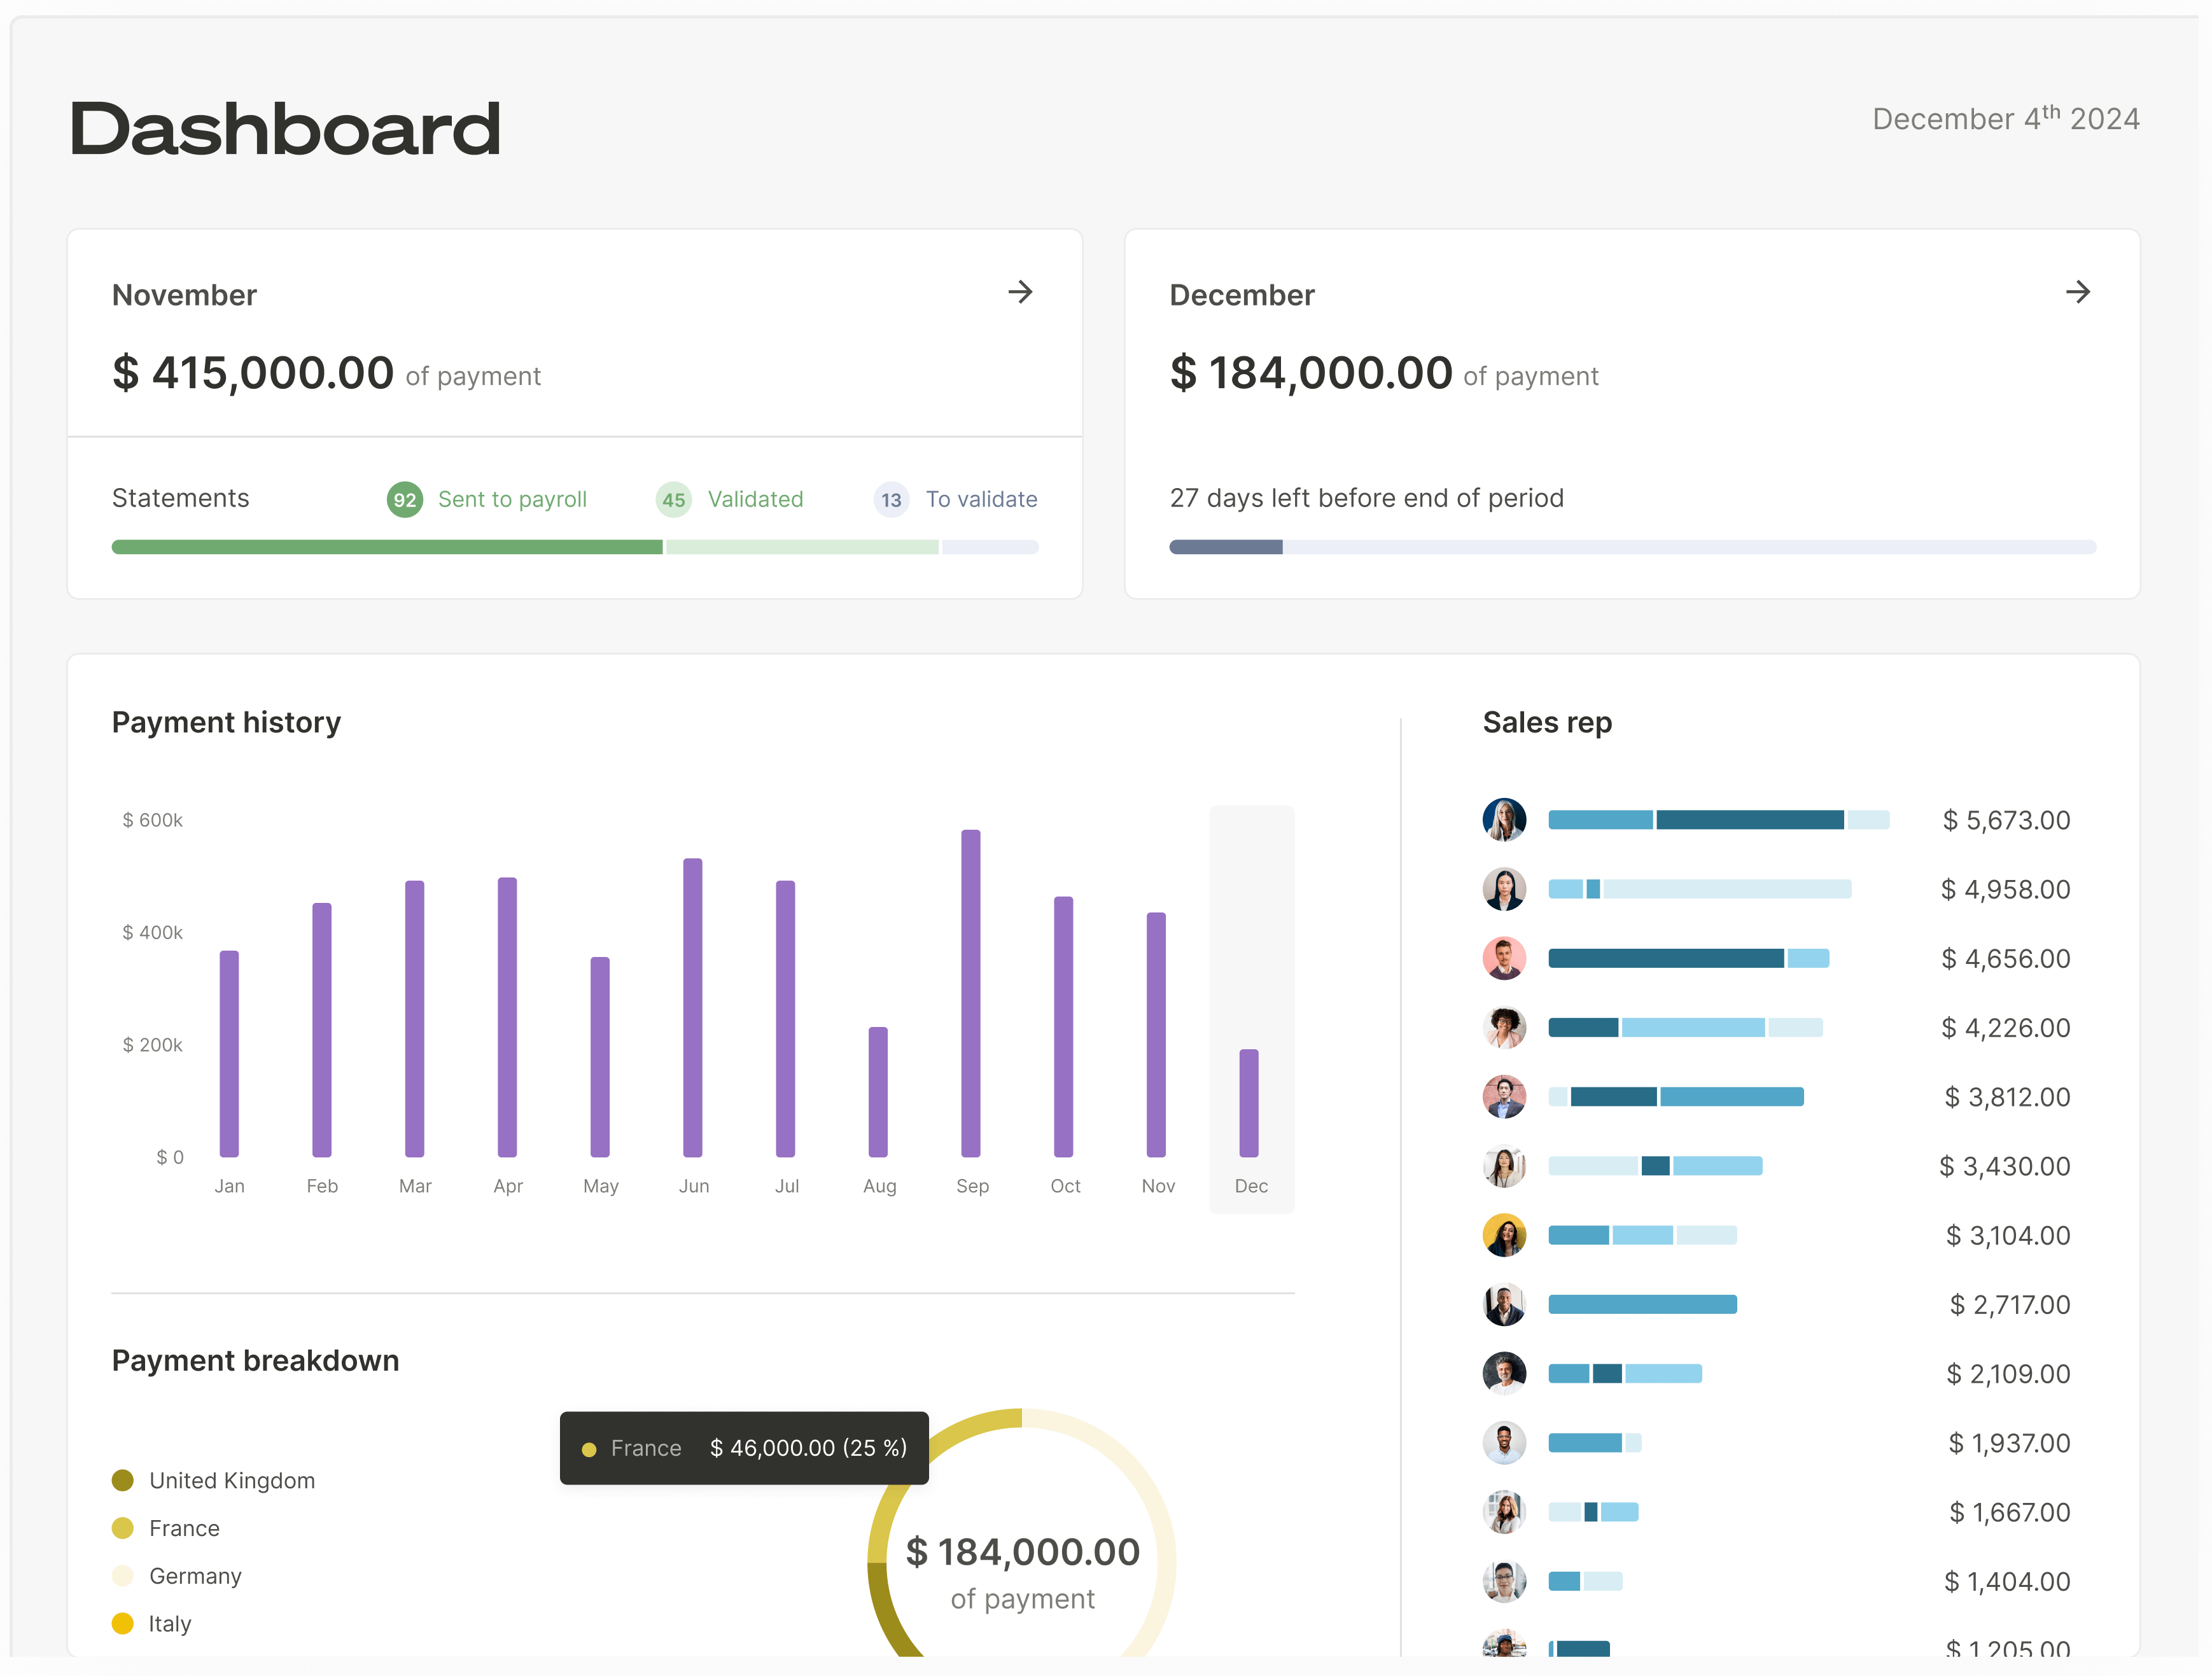
This data-first mindset should also apply to how you motivate your team. One of the most powerful motivators for a sales representative is their commission. When reps have real-time visibility into their potential earnings, it directly impacts their performance. Platforms that automate commission calculations provide this clarity. Instead of waiting until the end of the month to see a confusing spreadsheet, reps can see exactly how each deal impacts their take-home pay the moment it's closed in the CRM. This creates a direct link between action and reward, encouraging the behaviors that drive conversions.
Automate Non-Selling Activities
Studies have shown that sales reps spend a staggering amount of their time—often over 70%—on administrative and non-selling tasks. This includes logging activities, scheduling appointments, and, crucially, calculating and verifying commissions. Every minute spent on these tasks is a minute not spent prospecting, nurturing relationships, or closing deals.
Automating these processes is a massive lever for productivity. By implementing a dedicated sales optimization software, particularly for complex tasks like commission management, you can reclaim significant amounts of time for your sales team. A platform like Qobra automates the entire commission lifecycle, from real-time calculation based on CRM data to managing approval workflows and ensuring accurate payouts. This eliminates disputes, reduces administrative burden on both sales and ops teams, and allows reps to focus entirely on what they do best: selling.
📌 A Note on Upselling and Cross-selling
One of the most overlooked strategies for increasing revenue and conversions is selling more to your existing customers. You already have a relationship and understand their needs. Look for opportunities to introduce them to other products or services that can solve their emerging challenges. This not only increases customer lifetime value but is often an easier "sell" than acquiring a brand-new customer.
The Right Tools for Measuring and Optimizing Conversions
To effectively track and improve your conversion metrics, you need the right technology stack. These tools provide the data, insights, and automation necessary to turn your strategies into results.
Analytics and CRM Platforms
A Customer Relationship Management (CRM) system is the central nervous system of any modern sales organization. It houses all your customer and lead data, making it easier to track conversions, manage your pipeline, and identify what's working. When combined with web analytics tools like Google Analytics, you can get a full-circle view of the customer journey, from their first website visit to the final closed deal.
Specialized Compensation Software
While a CRM tracks the deals, a specialized compensation platform translates those deals into motivation and operational efficiency. The best B2B sales commission software integrates natively with your CRM, pulling deal data in real time to provide instant visibility for your entire team.
For instance, with Qobra, Sales Ops can use a 100% no-code editor to build complex compensation plans, Finance can rely on a complete audit trail for compliance, and reps can see their updated commissions immediately after closing a deal in Salesforce or HubSpot. This level of transparency transforms compensation from a confusing administrative task into a powerful performance driver. It aligns everyone around the same goal—closing more deals—and provides the real-time feedback necessary to keep motivation high.
🚨 Attention: The Danger of Vanity Metrics
Be cautious of focusing on metrics that look good on paper but don't translate to business success. For example, a huge number of website visitors is meaningless if none of them convert. Always tie your metrics back to bottom-line results like revenue, profitability, and customer lifetime value. This ensures your efforts are focused on activities that truly grow the business.
Improving your sales conversion rate is a continuous journey, not a one-time fix. It begins with a commitment to tracking the right metrics to understand your performance deeply. From there, you can identify opportunities for improvement, whether it's enhancing lead quality, simplifying the buying process, or motivating your team with transparent, real-time incentives. By combining smart strategies with powerful tools, you can turn more prospects into loyal customers and drive sustainable growth for your business.
Frequently Asked Questions
What is a good sales conversion rate and how often should I track it?
There is no universal "good" sales conversion rate, as it varies dramatically by industry, sales cycle length, price point, and lead source. For instance, a business selling a high-ticket enterprise software might have a conversion rate of 1-2% and be highly successful, while an e-commerce store might aim for 5-10%. The most important benchmark is your own historical data. The goal should be continuous improvement over your past performance. As for frequency, you should monitor your key conversion metrics regularly. A weekly review is ideal for tactical adjustments (e.g., tweaking an ad campaign), while a monthly or quarterly analysis is better for identifying broader trends and assessing the impact of major strategic initiatives.