Webinar: From Running Sales Commissions to Supervising AI Agents | Thursday, August 20
Register
Are you struggling to hit your sales goals, clear your sales funnel, or increase your sales velocity? Do you feel like you're navigating your team's performance with a compass that's constantly spinning? Sales reports are the solution, transforming that chaos into a clear, actionable map. These documents are far more than just a collection of numbers; they are a narrative of your team's efforts, a diagnostic tool for your strategy, and the foundation for sustainable growth.
Effective reporting allows you to pinpoint what’s working, what isn’t, and where the biggest opportunities lie. It helps you fill knowledge gaps, coach underperforming reps, and provide the C-suite with the hard data they need to make smart, timely decisions. If you're tired of making choices based on gut feelings and want to build a data-driven sales engine, it's time to master the art of the sales management report.
What Exactly is a Sales Management Report?
A sales management report is a comprehensive overview of a company's sales activities and performance over a specific period. Think of it as a health check for your sales operations. This document consolidates key data points, from individual rep activities to overall revenue generation, into an easily digestible format. The timeframe can vary depending on the objective; it could be a daily report tracking rep productivity, a weekly summary for tactical adjustments, a monthly analysis for managers, or a quarterly review for executive leadership.
The core purpose of a sales report extends beyond simple record-keeping. It's an analytical tool that provides valuable insights into sales trends, customer behavior, and the effectiveness of your strategies. For instance, a marketing director might use a sales report to see if a new lead magnet is generating quality opportunities, while a sales manager uses it to identify bottlenecks in the sales process.
Ultimately, a well-crafted sales report helps businesses understand not only their financial performance but also how sales efforts impact customer loyalty and retention. It provides the clarity needed to identify strengths, address weaknesses, and make informed decisions that drive revenue growth and operational efficiency.
Why Sales Reporting is Non-Negotiable for High-Performing Teams
In today's competitive landscape, relying on intuition alone is a recipe for falling behind. Consistent and thorough sales reporting provides the data-driven foundation that separates thriving sales organizations from those that merely survive. It transforms your sales process from a series of disjointed activities into a fine-tuned engine for growth.
Drive More Closed Deals and Eliminate Bottlenecks
The ultimate goal of any sales team is to close more deals. Sales reports are instrumental in achieving this by offering unparalleled visibility into the sales funnel. By quantifying your team's efforts at every stage, from prospecting and lead qualification to negotiation and closing, you can pinpoint exactly where deals are stalling or falling through.
Is there a significant drop-off after the initial demo? Perhaps your lead qualification process isn't rigorous enough. Are deals getting stuck in the proposal stage? Your team might need better training on overcoming objections. Reporting gives you this crucial information, allowing you to pull the right levers to fix issues. By testing new initiatives and measuring their impact in subsequent reports, you can systematically optimize your sales process to shorten the sales cycle and help your team win more often.
Uncover Actionable Trends and Patterns
Sales data is a goldmine of information. Sales reports are the tools you use to extract valuable trends and patterns that can dramatically improve productivity and results. By analyzing historical data, you can identify which activities, channels, or strategies yield the best outcomes.
For example, a report might reveal that follow-up emails sent within 24 hours of a discovery call increase close rates by 15%. This insight can then be standardized as a team-wide best practice. Conversely, the data might show that a long-standing cold-calling strategy is generating minimal returns, making a strong case for reallocating those resources to more effective channels. By tracking these metrics, sales managers can make informed decisions that boost efficiency and maximize revenue.
Foster Accountability and Reduce Micromanagement
When stakeholders across the organization lack a clear view of the sales team's performance, the natural tendency is to micromanage. Constant check-ins and requests for updates can frustrate sales reps and distract managers from more strategic tasks. Proactive sales reporting solves this problem by creating a culture of transparency and accountability.
When reports are shared regularly, everyone from the CEO to individual team members has a clear, objective look at performance. This visibility builds trust and empowers managers to lead strategically rather than tactically. It eliminates the need for constant supervision, freeing up everyone to focus on what they do best.
Align on Goals and Improve Forecasting Accuracy
Setting clear, achievable goals is fundamental to sales success. Sales reporting is the mechanism that allows organizations to track progress against these objectives. By comparing current performance to established targets, you can identify where the team is excelling and where they are falling short.
This data is also the backbone of reliable sales forecasting. Accurate forecasts are critical for resource planning, inventory management, and overall business strategy. By analyzing past performance and market trends, you can make informed predictions about future revenue. While many teams struggle with forecast accuracy, consistent reporting provides the historical data needed to refine your models and build confidence in your projections, turning forecasting from a guessing game into a strategic advantage.
The Essential Components of an Effective Sales Report
A powerful sales report is not just a data dump; it’s a curated collection of metrics that tell a clear story. To avoid overwhelming your audience, focus on the Key Performance Indicators (KPIs) that align directly with your business goals. While the specific components will vary based on the report's purpose and audience, most comprehensive sales analyses include a mix of the following metrics.
Here is a breakdown of common KPIs categorized by their focus area:
| Category | Key Metrics (KPIs) | What It Measures |
|---|---|---|
| Activity Metrics | - Number of Calls Made - Emails Sent - Meetings Scheduled - Demos Conducted | The volume of day-to-day work and effort from the sales team. These are often leading indicators of future performance. |
| Pipeline Metrics | - New Opportunities Created - Lead-to-Opportunity Ratio - Stage-by-Stage Conversion Rates - Average Sales Cycle Length | The health and flow of your sales funnel. This shows how effectively your team moves prospects toward a close. |
| Performance Metrics | - Revenue Generated (by rep, team, region) - Win Rate / Close Rate - Average Deal Size - Quota Attainment | The bottom-line results and overall effectiveness of your sales efforts. These are lagging indicators of success. |
| Customer Metrics | - Customer Churn Rate - Customer Lifetime Value (CLV) - Customer Acquisition Cost (CAC) - Customer Satisfaction Scores (CSAT) | The long-term health of your customer base and the efficiency of your sales and marketing spend. |
🚨 Attention: Avoid Vanity Metrics
Be cautious of focusing solely on "vanity metrics", numbers that look impressive on the surface but don't translate to business success. For example, a high number of calls made is meaningless if it doesn't lead to qualified opportunities. Always tie your KPIs back to tangible business outcomes like revenue, profit, or market share.
A Step-by-Step Guide to Creating Your Sales Report
Now that you understand the what and the why, it's time to build your report. Following a structured process ensures your final document is relevant, insightful, and drives action.
1. Define Your Audience and Purpose
Before you gather a single piece of data, ask yourself two critical questions: Who is this report for? and What do I want them to do with this information? The content and level of detail will change drastically depending on the audience.
- For Sales Reps: Focus on individual activity metrics, pipeline status, and progress toward quota. The goal is motivation and tactical guidance.
- For Sales Managers: Include team-wide performance, pipeline health, win/loss analysis, and forecast accuracy. The goal is team management and strategic adjustment.
- For Executives (C-suite): Present high-level summaries, revenue trends, market performance, and key takeaways. The goal is to inform broad business strategy.
2. Gather Your Data
Your sales data likely lives in multiple places: your CRM, point-of-sale (POS) systems, financial records, or even spreadsheets. Manually compiling this information is not only time-consuming but also prone to errors, which can lead to flawed insights and mistrust in the data.
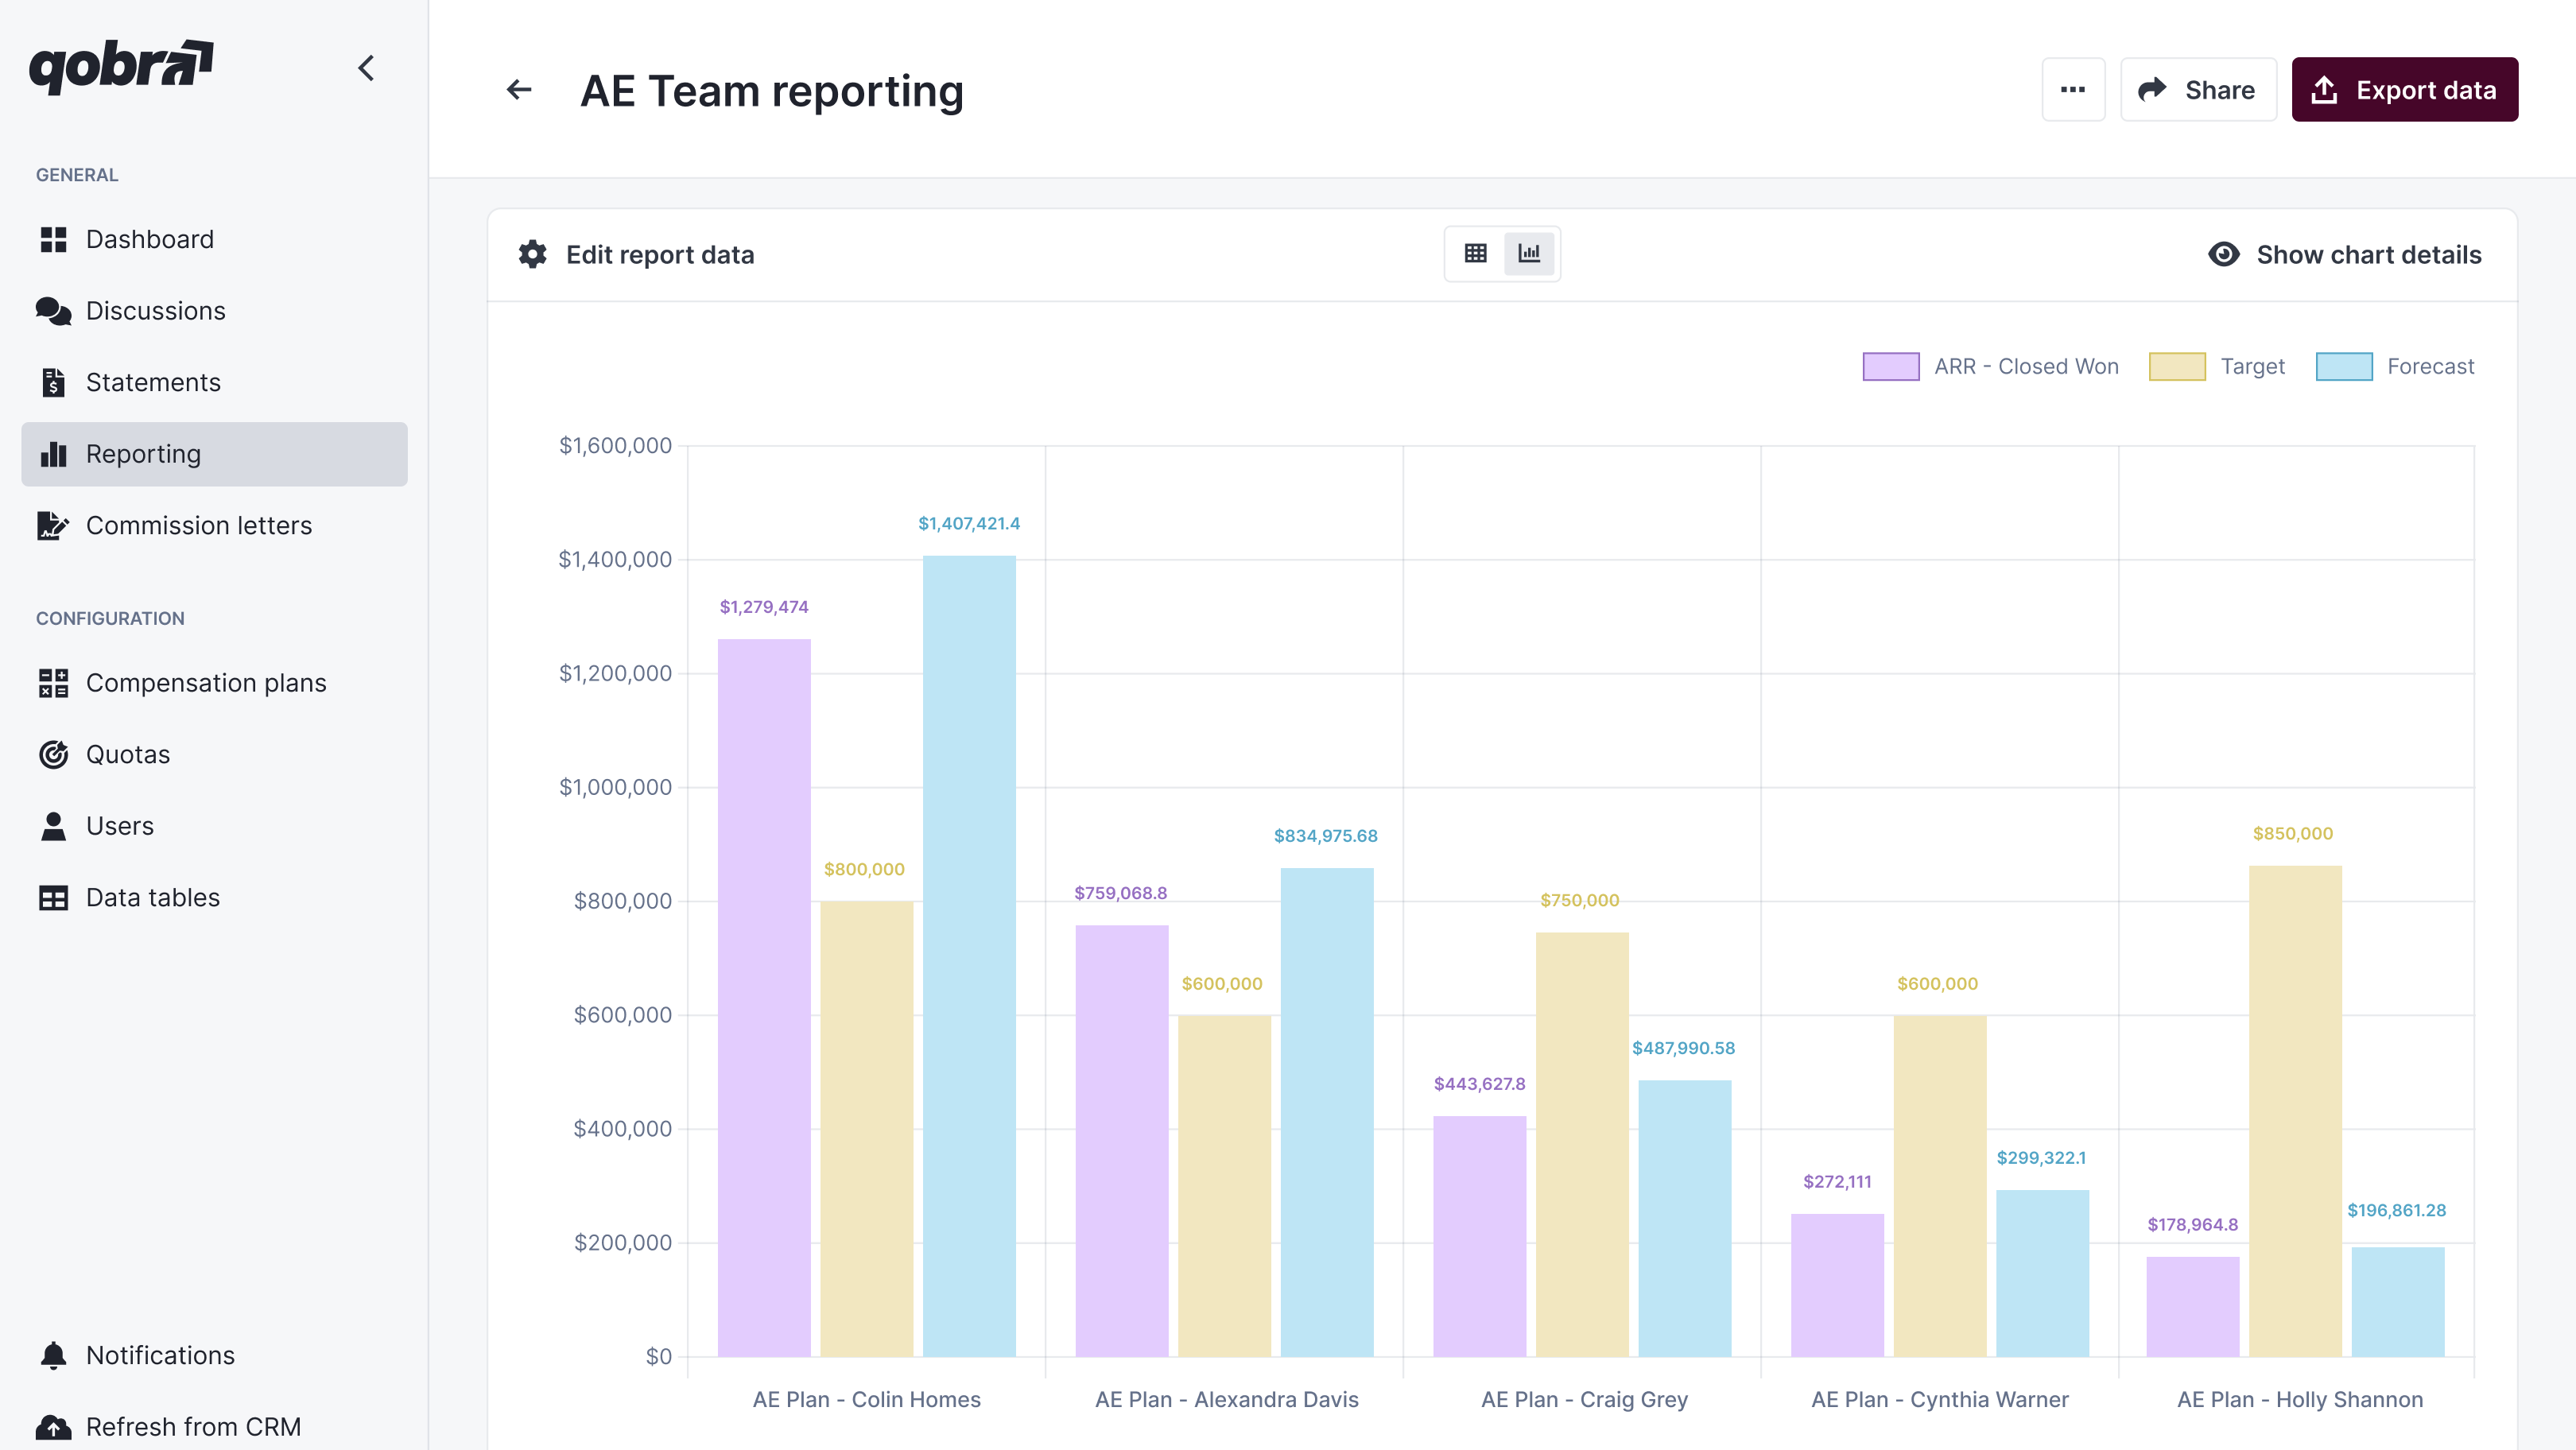
This is where automation becomes a game-changer. Instead of spending hours exporting CSVs and wrestling with VLOOKUPs, modern platforms can centralize this process. For example, a dedicated compensation platform like Qobra integrates natively with your CRM (like Salesforce or HubSpot) to pull deal data in real-time. This ensures that the performance data feeding into your reports, especially concerning commissions and revenue, is always accurate and up-to-date, eliminating manual work and providing a single source of truth for your entire organization.
3. Structure Your Report and Add Visuals
A wall of text and numbers is the fastest way to lose your audience's attention. Start with a simple outline:
- Section 1: Executive Summary: Briefly state the report's purpose, the time period covered, and the top 2-3 key findings or takeaways.
- Section 2: Data Findings & Visuals: Present your KPIs using charts, graphs, and tables. Visuals are processed thousands of times faster than text and are perfect for highlighting trends, comparisons, and outliers. A line graph can show revenue over time, while a bar chart can compare rep performance.
- Section 3: Analysis and Insights: This is the most crucial part. Don't just present the data; interpret it. Explain the "why" behind the numbers. If sales dipped in October, explain that it coincided with a major competitor's product launch. If one rep is outperforming others, analyze their methods to see what can be replicated.
4. Conclude with Actionable Next Steps
A report without a conclusion is just a collection of facts. Your final section should translate your insights into a clear action plan. What should the team start, stop, or continue doing based on this report? Assign specific responsibilities and set deadlines to ensure accountability. This turns your report from a passive document into an active tool for improvement.

Key Types of Sales Management Reports Your Team Needs
While you can create countless custom reports, a few standard types form the foundation of any robust sales analysis strategy. Here are some of the most critical reports every sales leader should be tracking.
Sales Pipeline Report
This is a visual representation of all active opportunities in your sales funnel, categorized by stage. It's a must-have for assessing the overall health of your business. A pipeline report helps you identify where deals are concentrated, forecast future revenue with greater accuracy, and spot potential blockages before they become critical problems. It answers questions like: Are we generating enough new leads to hit our future targets? and Where do we need to focus our coaching efforts?
Conversion Rates Report
Conversion rates measure your team's effectiveness at moving prospects from one stage of the sales cycle to the next. You can track macro-conversions (like lead-to-customer) or micro-conversions (like initial contact-to-demo-scheduled). Analyzing these rates helps you understand the strengths and weaknesses of your sales process and individual reps. A low conversion rate at a specific stage indicates a clear area for improvement, whether through better training, refined messaging, or new sales tools and technologies.
Sales Cycle Length and Velocity Report
Average sales cycle length is the time it takes to close a deal, from initial contact to final signature. Sales velocity measures how quickly deals are moving through your pipeline and generating revenue. Tracking these metrics helps you gauge the efficiency of your sales process. If your sales cycle is getting longer, it might signal issues with your qualification process or an increase in market competition. Improving your sales velocity is one of the fastest ways to accelerate revenue growth.
Win/Loss Analysis Report
Understanding why you win deals is great, but understanding why you lose them is often even more valuable. This report analyzes closed-won and closed-lost opportunities to identify patterns. Are you consistently losing to a specific competitor? Is price the most common objection? Are certain product features repeatedly mentioned as deal-breakers? These insights are invaluable for refining your product, pricing, and sales strategy.
Revenue and Deal Size Report
This report focuses on the bottom-line results. It tracks total revenue generated, often broken down by rep, team, product line, or territory. The average deal size metric is crucial for revenue forecasting and setting realistic sales quotas. If your average deal size is increasing, it's a sign that your team is successfully upselling or moving into larger accounts.
Sales Activity Report
This report tracks the leading indicators of sales success: the number of calls made, emails sent, meetings booked, and demos conducted. While these are effort-based metrics, they are essential for managing new hires, diagnosing performance issues, and ensuring the team is maintaining the level of activity required to fill the pipeline. It helps answer the question: Is the team doing the right amount of the right activities?
Best Practices for Sales Reporting Success
Creating reports is one thing; creating reports that people actually use and value is another. Adhering to a few best practices can make all the difference.
Set Clear Goals for Your Reporting
Before building a dashboard or template, start with the end in mind. What specific business question are you trying to answer? Are you trying to improve forecast accuracy, identify top performers, or optimize a stage in your sales funnel? A report without a clear goal quickly becomes a cluttered collection of data that no one looks at.
Standardize and Automate
Consistency is key. Use standardized templates for your reports so that everyone is looking at the same metrics in the same format every time. This makes it easier to track trends and compare performance over different periods. More importantly, automate the process. Manual reporting is a time-drain and a recipe for human error.
Leveraging a platform like Qobra automates the entire compensation calculation and reporting process. By connecting directly to your CRM, it eliminates the need for manual data entry into spreadsheets, which saves Sales Ops teams dozens of hours each month. Reps get real-time visibility into their commission earnings, Finance can easily audit payments, and managers get accurate, on-demand reports, creating a single, reliable source of truth for one of the most critical sales metrics: compensation. This automation is crucial for scaling your sales operations effectively, especially for startups.
💡 Expert Advice
Your reports are only as good as the data they're built on. Enforce strict data hygiene standards within your CRM. Ensure that reps consistently update deal stages, log all activities, and fill out required fields. "Garbage in, garbage out" is a reality, clean data is the bedrock of insightful reporting.
Keep it Concise and Visual
Less is often more. It's tempting to pack a report with every metric imaginable, but this usually leads to information overload. Focus on the few KPIs that matter most for the report's objective. Use visuals like charts and graphs to make complex data easy to understand at a glance. A well-designed dashboard should communicate the key takeaways in seconds, not minutes.
Follow Up and Monitor Progress
The reporting process doesn't end when you hit "send." The real value comes from the discussions and actions that follow. Schedule regular meetings to review the reports with your team. Discuss the findings, celebrate wins, brainstorm solutions for challenges, and commit to specific next steps. Then, use the next report to track progress against those commitments. This creates a continuous feedback loop of measurement, analysis, and improvement.
Free Sales Report Templates to Get You Started
Building a sales report from scratch can be daunting. To help you hit the ground running, here are a few essential templates that you can adapt for your business.
- Forecasted vs. Actual Sales Template: This report is vital for tracking progress against goals. It typically includes columns for the sales forecast, the actual sales achieved, and the variance (positive or negative). This allows you to quickly see if you are on track to hit your monthly or quarterly targets and make adjustments as needed.
- Weekly Activity Report Template: Perfect for sales managers, this template tracks the key activities of each rep over the week. Common metrics include calls made, emails sent, meetings set, and new opportunities created. It provides a quick snapshot of team productivity and helps identify reps who may need extra coaching or support.
- Reasons for Lost Deals Template: To gain strategic insights, you need to understand why deals are lost. This template standardizes the process by providing a dropdown list of common loss reasons (e.g., Pricing, Competitor, Bad Timing, Missing Features). Over time, this data will reveal patterns that can inform your sales and product strategy.
- Monthly Sales Dashboard Template: This provides a high-level overview of performance for senior management. It should be highly visual, using dashboards and charts to display key metrics like total revenue, quota attainment, average deal size, and win rate for the month. It’s designed for quick consumption and strategic decision-making.
By leveraging these templates and the principles of effective reporting, you can transform your sales data from a confusing jumble of numbers into your most powerful strategic asset. The key is to move away from reactive, manual processes and embrace a proactive, automated approach that provides real-time, transparent insights. This not only drives revenue but also fosters a culture of accountability, motivation, and continuous improvement across your entire sales organization.
FAQ: How often should we generate sales management reports?
How often should sales management reports be generated?
The ideal frequency for sales reports depends on their purpose and audience. There isn't a one-size-fits-all answer, but a good framework is:
- Daily: Best for individual sales reps to track their personal activities and progress. Daily reports often focus on leading indicators like calls, emails, and meetings set.
- Weekly: Ideal for sales managers and teams. Weekly reports are used for tactical adjustments, pipeline reviews, and keeping the team on track to meet monthly goals. They typically include metrics like new opportunities, conversion rates, and progress to quota.
- Monthly & Quarterly: Suited for senior leadership and strategic planning. These reports provide a big-picture view of sales performance, highlighting long-term trends, comparing results against company goals, and informing future strategy. They focus on high-level outcomes like total revenue, market share, and customer lifetime value.